TF03 Lidar and Arduino
Introduction

Long Manual https://acroname.com/sites/default/files/assets/tf03_product_manual_v0.4_en.pdf
TF (ToF; Time of Flight). https://www.sparkfun.com/products/19421
- Range ~100 m
- Resolution ~0.01 m/ Accuracy 0.1 m.
- Frame rate 1Hz - 1000 Hz
- wavelength: 905 nm. Laser class 1 (IEC 60825)
- Angle 0.5 deg; Spot size @100 m 28x28 cm2.
- Current ˝200 mA. Power ~1W
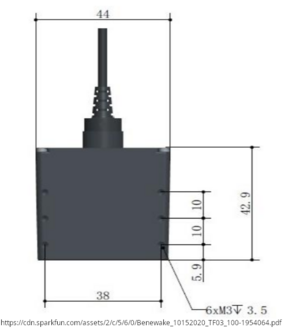
- Dimensions 44x43x32 mm3.
- Weight 77g
- IP67
- Mounting holes for M3 screws
- Connector: Molex 1.25 or Molex SD-51021-007 (1.25 W/B) 7 pin or mh1.25-7p. Pin to pin pitch is 1.25 mm. Identity electrical connectors: https://core-electronics.com.au/guides/Identify-Electrical-Connectors/#Molex
See more
- https://cdn.sparkfun.com/assets/2/c/5/6/0/Benewake_10152020_TF03_100-1954064.pdf
- https://cdn.sparkfun.com/assets/4/e/5/b/5/PM-15180.pdf
Need to measure angle. Use an accelerometer
Note the laser safety. Check whether the power supply is working properly, and whether the voltage level is kept within the range of the rated input voltage. If the power supply is normal, the TF03 lens will display a faint red light.
| No | Color | Standard: Pin | Standard: Function | RS485: PIN | RS485: Function |
|---|---|---|---|---|---|
| 1 | Red | Vcc | Power | Vcc | Power |
| 2 | White | CAN_L | CAN_L | RS485-B/RS232-RX | Receive |
| 3 | Green | CAN_H | CAN_H | RS485-B/RS232-TX | Transport |
| 4 | |||||
| 5 | Blue | UART_RX | Receive | UART_RX | Receive |
| 6 | Brown | UART_TX | Transport | UART_TX | Transport |
| 7 | Black | GND | Ground | GND | Ground |
The standard version of TF03 supports both, UART and CAN communication interface. The default interface is UART. The CAN mode can be set by sending command, but two interfaces cannot output simultaneously.
The default TX/RX pins on an Arduino board are the D0(RX) and D1(TX) pins.
| Data bit | Definition | Description |
|---|---|---|
| Byte0 | Frame Header | 0x59 |
| Byte1 | Frame Header | 0x59 |
| Byte2 | DIST_L | DIST low 8-bits |
| Byte3 | DIST_H | DIST high 8-bits |
| Byte4 | Reserved | (Signal strength L) |
| Byte5 | Reserved | (Signal strength H) |
| Byte6 | Reserved | |
| Byte7 | Reserved | |
| Byte8 | Checksum | Checksum = Byte0 + Byte2 + ... 0 Byte7 |
Signal strength is between 0 and 3500. The threshold is 40. Between 40 and 1200 distance is more reliable. If there is a high reflectivity object, strength will be over 1500.
Gyro (gimbal without servos)
Some starting points for the first version:
- Self-leveling cupholder, 2-axis gimbal https://www.thingiverse.com/thing:1004856
- Gyro Cup Holder https://www.thingiverse.com/thing:3478264
- Gyro Drink Holder https://www.thingiverse.com/thing:6694160
I have some roller skate ball bearings
- Outer diameter 22 mm
- Thickness 7 mm
- Inner diameter 8 mm
File:Lidar_gyro.blend.zip[[1]]
2 Byte Conversion to decimal
The two bytes (high and low) need to be concatenated and displayed as a decimal number.
- Byte[2] = DIST_L, low 8 bits
- Byte[3] = DIST_H, high 8 bits
For example, 10101010 01010101 gives 43605.
We need to left shift high bits by 8 bits and union the two numbers by using eg or operation
uint8_t = dist_l;
uint8_t = dist_h;
uint16_t = dist;

dist = dist_h;
dist <<= 8;
dist = dist | dist_l
Serial.print( dist, HEX )
Serial.print( dist, BIN )
The left shift moves bits to the left and pads from the right with zeroes. Eg, 0000 1110 << 2 will be 0011 1000.
Lidar & Arduino
Connections
- Arduino: D0 (RX), TF03: 6 (Brown, UART TX)
- Arduino: D1 (TX), TF03: 5 (Blue, UART RX)
The serial port version of TF03 adopts UART-LVTTL interface, and the output level is LVTTL level (0-3.3V).
Lidar Voltage: 5 - 24 V (https://cdn.sparkfun.com/assets/2/c/5/6/0/Benewake_10152020_TF03_100-1954064.pdf); Current 150 mA @ 5V, 80 mA @ 12V, 50 mA @ 24 V. Power consumption: 1 W.
Communication protocol UART
- Baud rate 115200
- Data bit 8
- Stop bit 1
- Checksum bit None
void setup(){
  Serial.begin(115200);
}
void loop(){
  if (Serial.available() > 0){  // returns the number of bytes waiting in the buffer
    processInputByte(Serial.read());
  }
}
See also https://lastminuteengineers.com/tfmini-s-lidar-sensor-arduino-tutorial/
ProcessInputByte subroutine
This subroutine will take care of reading the bits.
void processInputByte(unsigned char inByte){
  if ( recvdByte < 2){
    if (inByte != start_signature[recvdByte]) {  // Check the headers; frame header
            recvdByte = 0;  // discard the packet
            return;
    }
  if ( recvdByte > 4 && recvdByte < 8){   //Do checks ???
  }
  } else if (recvdByte == 8) {  // check sum
        // TODO: Look at the datasheet to see how to control that
        // the checksum is correct. Discard the packet if it is not.
  }

  // All correct so far, we can buffer the incoming byte.
  packet[recvdByte++] = inByte;

  // If we have a complete packet now, handle it.
  if (recvdByte == 9 ) {
      dist_l = char(packet[2]);
      dist_h = char(packet[3]);

      dist = dist_h;
      dist <<= 8;
      dist = dist | dist_l;
      Serial.println( dist, DEC );

      recvdByte = 0;  // reset for the next packet
      dataLength = 0;
  }
}
That's all.
Reading Digital Pins

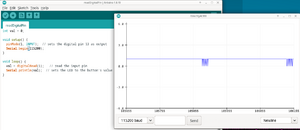
While reading the digital pin, we get some data. However, it looks rather similar and boring.
int val = 0;

void setup() {
  pinMode(1, INPUT);  // sets the digital pin 13 as output
  Serial.begin(115200);
}

void loop() {
  val = digitalRead(1);   // read the input pin
  Serial.println(val);  // sets the LED to the button's value
}
TX/RX pins
Use Digital 0, but uploading fails. Need to unplug the wire, upload the code and plug the wire ; gives
| Frame Header | Frame Header | Dist_L | Dist_H | Reserved | Reserved | Reserved | Reserved | Checksum |
|---|---|---|---|---|---|---|---|---|
| 59 | 59 | 35 | 0 | 37 | 0 | 0 | 0 | 1E |
where
- Dist_L is distance low 8 bits
- Dist_H is distance hight 8 bits
- Checksum is Low 8 bits of checksum; checksum = Byte0 + Byte2 + ... + Byte7
Software Serial

However, according https://arduino.stackexchange.com/questions/91215/how-to-read-and-parse-uart-data-from-human-presence-radar-sensor Software Serial should not be used:
- against using SoftwareSerial, especially at this high baud rates: it is a recipe for problems.
- Connect the sensor's TX to the Arduino RX, and you will be able to read the sensor data with Serial.read().
- Do not connect the sensor's RX, and you will be able to Serial.print() to the serial monitor without disturbing the sensor.
#include <SoftwareSerial.h>
//SoftwareSerial Serial1(0, 1); // RX, TX
SoftwareSerial Serial1(1, 0); // RX, TX
int val = 0;
int incomingByte = 0;

void setup() {
  Serial.begin(115200);
}
void loop() {
  Serial.print("Available: ");
  Serial.println( Serial1.available() );
  incomingByte = Serial1.read();
  Serial.println( incomingByte, HEX);

  if (Serial1.available() > 0){  // returns the number of bytes waiting in the buffer
    incomingByte = Serial1.read();
    //Serial.println( incomingByte, DEC);
  }
}
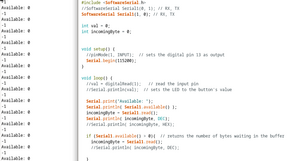
And this gives bad results, see the image. The program and results are shown. The results are not very convincing. However, in the beginning, it gives some data.
References
See also https://ardupilot.org/copter/docs/common-benewake-tf02-lidar.html
and Benewake TF02 manual.
Data into PC
Some methods:
- Browser: Potree https://github.com/potree/potree/ needs its own dataformat, so not probably real time visualization.
- Python: Point Cloud Open 3D https://www.open3d.org/docs/release/tutorial/geometry/pointcloud.html . Real time rendering works https://stackoverflow.com/questions/65774814/adding-new-points-to-point-cloud-in-real-time-open3d
https://wiki.python.org/moin/NumericAndScientific/Plotting
Python and PySerial
Note that Readline is very slow, use own method instead: https://stackoverflow.com/questions/29557353/how-can-i-improve-pyserial-read-speed. This is fast, but the drawing is too slow.
- Use blitting?
- See SciPy: Cookbook/ Matplotlib/ Animations https://scipy.github.io/old-wiki/pages/Cookbook/Matplotlib/Animations
- OpenGL is very very fast (eg. millions of lines can be drawn per seconds) although it is cumbersome to use.
- VTK is a quite fast library to manage huge amount of data in a reasonable time
- QtAgg backend?
- Check
- Always check dtypes (especially when it comes to datetimes). It might seem reasonable to assume a dtype but pandas might interpret the data differently.
- Always test with a small sample. Then you would have noticed that each datapoint is labelled (slowing down the rendering because each individual label has to be printed) and that the labels are evenly spaced but not plotted in numerical order. https://stackoverflow.com/questions/71257611/faster-plotting-in-matplotlib-or-better-options
https://stackoverflow.com/questions/8955869/why-is-plotting-with-matplotlib-so-slow?rq=4 get 200 fps by using blit command.
Python and GNUPlot
Old
Mayavi
OpenGL: VisPy
Vispy.org Easy. Use (as normally) via virtual machine. Install using virtual machine. A lot of example codes on the www page.
Below is a simple example with constant number of data points. Use normal headers and add canvas together with view. Also, add a global variable to be updated in the update function.
import numpy as np
import vispy.scene
from vispy.scene import visuals
from vispy.app import Timer

# Make a canvas and add simple view
canvas = vispy.scene.SceneCanvas(keys='interactive', show=True)
view = canvas.central_widget.add_view()

global scatter
Then, generate some data into pos variable and make a scatter object
scatter = visuals.Markers()
scatter.set_data(pos, edge_width=0, face_color=(1, .1, .8, .5), size=5, symbol=symbols)

view.add(scatter) #scatter.parent = None   #Removes the data
view.camera = 'turntable'  # or try 'arcball'
The update function is simple
def update(event):
    dx = np.random.normal(size=(N, 3), scale=0.01)
    global pos
    pos = pos + dx

    scatter.set_data(pos, edge_width=0, face_color=(1, .1, .8, .5), size=5, symbol=symbols)
And finally set the timer
timer = vispy.app.Timer()
timer.connect(update)
timer.start(0)
Thus, now we need to run the app
if __name__ == '__main__':
    import sys
    if sys.flags.interactive != 1:
        vispy.app.run()
Vispy: Change one at a time
OpenGL PyQTGraphs
PyQTGraph works great for 2d graphing. . .
- VisPy https://vispy.org/ couldn't install. . .
- Py QT Graph https://www.pyqtgraph.org/
- Note 1: pyqtgraph.opengl is based on the deprecated OpenGL fixed-function pipeline. Although it is currently a functioning system, it is likely to be superceded in the future by VisPy.
- https://www.pythonguis.com/tutorials/plotting-pyqtgraph/
- https://brainflow.org/2021-07-05-real-time-example/ this looks good example
- https://github.com/ZeitgeberH/patchview a list of tutorials and examples and packages
- Chaco is a 2D. https://docs.enthought.com/chaco/
- PlotPy is 2d: https://github.com/PlotPyStack/plotpy
GLUT is the OpenGL Utility Toolkit.
Python and OpenGL https://www.labri.fr/perso/nrougier/python-opengl/
OpenGL Programming Scientific https://en.wikibooks.org/wiki/OpenGL_Programming/Scientific_OpenGL_Tutorial_01
Python drawing point and line pyopengl https://cppsecrets.com/users/43051071171109710811510497114109975457495264103109971051084699111109/Python-Drawing-Point-and-Line-PyOpenGL.php https://cppsecrets.com/users/43051071171109710811510497114109975457495264103109971051084699111109/Python-Moving-2D-Plots-PyOpenGL.php
https://androidwedakarayo.com/graphic-designing-using-opengl-and-python-beginners
Developing Graphics Frameworks with Python and OpenGL https://library.oapen.org/bitstream/handle/20.500.12657/48838/9781000407952.pdf?sequence=1&isAllowed=y
Points, Circles and Lines https://edeleastar.github.io/opengl-programming/topic02/pdf/3.Points_Circles_and_Lines.pdf
- glOrtho (Cartesian coordinate space)
- glVertex (single point in space)
- glClear(), glBegin(GL_POINTS), glVertex3f, geEnd(), glutSwapBuffers()
OpenGL VisPy
- Good tutorial on the very basics: https://github.com/ipython-books/cookbook-code/blob/master/featured/06_vispy.ipynb
- VisPy learning site: https://vispy.org/resources.html
- Realtime Data Tutorial https://vispy.org/gallery/scene/realtime_data/index.html
- Update https://stackoverflow.com/questions/61212937/how-to-plot-in-real-time-with-vispy-library
- 3D Lidar plotting https://stackoverflow.com/questions/54207490/create-matplotlib-style-3d-scattergraph-z-axis-in-vispy
OpenGL Open3d
- GraphicsWindow has been deprecated, you should replace it with GraphicsLayoutWidget.