Pandas Read CSV and animate the data
From wikiluntti
Introduction
Read CSV data, filter, interpolate and smooth it, and the animate the plotting. The file is File:Convergence dataOnly.csv.
| Size | 10 | 15 | 20 | 40 | 50 | 100 | 500 | 1000 | 1500 | 3000 | 3000 | ||
| Nodes | n | 560842 | 240807 | 172644 | 110324 | 103903 | 101052 | 100919 | 138706 | 100919 | 77741 | 69092 | |
| Triangles | n | 140118 | 70994 | 48044 | 28684 | 26868 | 26024 | 25948 | 29970 | 25948 | 23230 | 22232 | |
| Tetrahedrons | n | 313370 | 126061 | 92463 | 60451 | 57002 | 55513 | 55480 | 80746 | 55480 | 40067 | 34291 | |
| Displacement magnitude | max | mm | 0 | 0 | 0 | 0 | 0 | 0 | 0 | 0 | 0 | 0 | 0 |
| Displacement magnitude | min | mm | 0.2 | 0.2 | 0.2 | 0.2 | 0.2 | 0.2 | 0.2 | 0.2 | 0.2 | 0.2 | 0.2 |
| Displacement X | max | um | -31.59 | -31.59 | -31.59 | -31.59 | -31.56 | -31.46 | -31.47 | -31.32 | -31.47 | -31.33 | -30.91 |
| Displacement X | min | um | 1.45 | 1.45 | 1.45 | 1.45 | 1.44 | 1.43 | 1.42 | 1.46 | 1.42 | 1.37 | 1.28 |
| Displacement Y | max | um | -12.69 | -12.69 | -12.69 | -12.69 | -12.68 | -12.67 | -12.67 | -12.69 | -12.67 | -12.64 | -12.57 |
| Displacement Y | min | um | 16.03 | 16.03 | 16.03 | 16.03 | 16.03 | 16.01 | 16 | 15.98 | 16 | 16.01 | 16.1 |
| Displacement Z | max | mm | -0.2 | -0.2 | -0.2 | -0.2 | -0.2 | -0.2 | -0.2 | -0.2 | -0.2 | -0.2 | -0.2 |
| Displacement Z | min | um | 1.8 | 1.8 | 1.8 | 1.8 | 1.8 | 1.81 | 1.81 | 1.81 | 1.81 | 1.77 | 1.71 |
| von Mises Stress | max | kPa | 0 | 0 | 0 | 0 | 0 | 0 | 0 | 0 | 0 | 0 | 0 |
| von Mises Stress | min | kPa | 1281.81 | 1281.81 | 1281.81 | 1281.81 | 1297.14 | 1311.81 | 1286.65 | 1250 | 1286.65 | 1273.95 | 1282.35 |
| Max Principal Stress | max | kPa | -176.22 | -176.22 | -176.22 | -176.22 | -172.74 | -172.69 | -171.95 | -184.54 | -171.95 | -169.48 | -180.97 |
| Max Principal Stress | min | kPa | 967.43 | 967.43 | 967.43 | 967.43 | 1014.52 | 955.45 | 1085.01 | 1140.49 | 1085.01 | 798.06 | 754.78 |
| Min Principal Stress | max | kPa | -1345.87 | -1345.87 | -1345.87 | -1345.87 | -1358.44 | -1343.18 | -1306.44 | -1295.94 | -1306.44 | -1325.73 | -1359.73 |
| Min Principal Stress | min | kPa | 109.99 | 109.99 | 109.99 | 109.99 | 108.23 | 114.84 | 115.2 | 126.83 | 115.2 | 106.69 | 119.98 |
| Max Shear Stress | max | kPa | 0 | 0 | 0 | 0 | 0 | 0 | 0 | 0 | 0 | 0 | 0 |
| Max Shear Stress | min | kPa | 648.93 | 648.93 | 648.93 | 648.93 | 658.46 | 663.91 | 654.4 | 628.53 | 654.4 | 647.25 | 647.95 |
Read and Interpolate
-
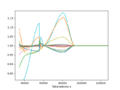
Interpolated data
-
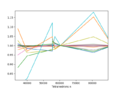
Original, non-interpolated data


import matplotlib.pyplot as plt
import pandas  as pd
import numpy as np

#Read, transpose, sort, drop and set the index to be the number of tetrahedrons
#and drop the columns with zero values and some parameters
df = pd.read_csv("convergence_dataOnly.csv" ).T
df.columns = ( df.iloc[0] + " " + df.iloc[1] )
df = df[3:].sort_values("Tetrahedrons n")
df.set_index("Tetrahedrons n", inplace=True)
df = df.drop('Displacement magnitude max', axis=1)
df = df.drop('von Mises Stress max', axis=1)
df = df.drop('Max Shear Stress max', axis=1)
df = df.drop('Nodes n', axis=1)
df = df.drop('Triangles n', axis=1)

#Convert values and index to numeric
df= df.apply(pd.to_numeric)
df.index = pd.to_numeric( df.index, errors='coerce' )

# Interpolate # Need to drop the one with the same number of tetrahedrons
mask = np.ones( len(df), dtype=bool)
mask[2] = False
df = df[mask]

#Get the percentage
df = df.divide( df.iloc[9] )
print(df)

df_i = df.reindex(df.index.union(np.linspace(df.index.min(),df.index.max(), df.index.shape[0]*10)))  # insert 10 NaN points between existing ones
df_i = df_i.interpolate('pchip', order=2)  # fill the gaps with values
df_i.plot( legend=False)  # draw new Dataframe