AIS visualization TASK: Difference between revisions
| Line 39: | Line 39: | ||
); | ); | ||
</syntaxhighlight> | </syntaxhighlight> | ||
Use it eg from the command line: <code>sqlite3 ais.db "SELECT COUNT(*) FROM ais_data;"</code>. | |||
The following code [[AIS Save to database using Python]] will save the data. | The following code [[AIS Save to database using Python]] will save the data. | ||
Revision as of 16:56, 22 June 2026
Introduction
-
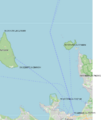
The map and some coordinates
-

The map shall be transformed to photo


The position of vessels on a photo.
Software
- rtl_ais -n -> parser -> database
- Ship162 is nice
ship162 --interactive rtlsdr:// - AIS-catcher https://github.com/jvde-github/AIS-catcher COULDN't get working
- GNU AIS is old, GNU radio is newer but rather heavy.
Data acquisition
USE RTL-AIS, ship162 (https://github.com/xoolive/ship162) project and Python, with tape measure antenna.
Or GNU AIS saves the data to local MySQL server.
rtl_ais
Sqlite3 database
CREATE TABLE ais_data (
    id INTEGER PRIMARY KEY AUTOINCREMENT,
    ts DATETIME DEFAULT CURRENT_TIMESTAMP,
    mmsi INTEGER,
    msg_type INTEGER,
    lat REAL,
    lon REAL,
    sog REAL,
    cog REAL,
    heading REAL,
    shipname TEXT,
    raw TEXT
);
Use it eg from the command line: sqlite3 ais.db "SELECT COUNT(*) FROM ais_data;".
The following code AIS Save to database using Python will save the data.
Transform
Some ideas to generate the transformation. Full camera projection is not needed here.
The latitude/longitude scale is not a linear measure. Thus, to a conversion to metric scale is better. UTM projection (pyproj) or using a local tangent plane. The UTM projection works better for this 10-20 km distances.
Plan
The coordinate system of the map is WGS84 EPS:4326 to EPSG:32635.
The mapping and ideas
- Get the mapping ship's GNSS coordinates to image coordinates
- Convert GNSS coordinates to UTM and then to metric points. Change the origin such that the metric numbers are reasonable.
- Find the corresponding pixels at the photo image.
- Compute homography matrix
- For testing purposes plot the GNSS value on the map.
- Create other homology mapping between GNSS coordinates and the map
- Create other homology mapping between GNSS coordinates and the map
UTM projection
The latitude/longitude scale is not a linear measure. Thus, to a conversion to metric scale is better. UTM projection (pyproj) or using a local tangent plane. The UTM projection works better for this 10-20 km distances.
# WGS84 GPS -> UTM zone 35N
transformer = Transformer.from_crs(
    "EPSG:4326",
    "EPSG:32635",
    always_xy=True
)


gps_points = np.array([
[59.4480442,24.7727679],
[59.4720746,24.7267166],
[59.5183884,24.7962952],
[59.5226077,24.5841614],
[59.5770763,24.7294084]
])

utm_points = []
for lon, lat in gps_points:
    x, y = transformer.transform(lon, lat)
    utm_points.append([x, y])

x0, y0 = utm_points[2]
local_points = []
for x, y in utm_points:
    local_points.append([x - x0, y - y0])

print(local_points)
Homology
https://docs.opencv.org/4.x/d9/dab/tutorial_homography.html
The simplest;

Should have some 10-50 corresponding pairs to get the mapping correct. Use least squares or SVD, but OpenCV works with RANSAC.
Non rigid spatial warp
Thin plate spline, where and



