AIS visualization TASK: Difference between revisions
From wikiluntti
| Line 19: | Line 19: | ||
The latitude/longitude scale is not a linear measure. Thus, to a conversion to metric scale is better. UTM projection (pyproj) or | The latitude/longitude scale is not a linear measure. Thus, to a conversion to metric scale is better. UTM projection (pyproj) or using a local tangent plane. | ||
=== Homology === | === Homology === | ||
Revision as of 14:26, 15 May 2026
Introduction
-
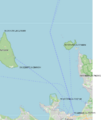
The map and some coordinates
-

The map shall be transformed to photo


The position of vessels on a photo.
Data acquisition
USE RTL-AIS, ship162 (https://github.com/xoolive/ship162) project and Python, with tape measure antenna.
Or GNU AIS saves the data to local MySQL server.
Transform
Some ideas to generate the transformation. Full camera projection is not needed here.
The latitude/longitude scale is not a linear measure. Thus, to a conversion to metric scale is better. UTM projection (pyproj) or using a local tangent plane.
Homology
https://docs.opencv.org/4.x/d9/dab/tutorial_homography.html
The simplest;

Should have some 10-50 corresponding pairs to get the mapping correct. Use least squares or SVD, but OpenCV works with RANSAC.
Non rigid spatial warp
Thin plate spline, where and



