AIS visualization TASK: Difference between revisions
From wikiluntti
No edit summary |
|||
| Line 31: | Line 31: | ||
Should have some 10-50 corresponding pairs to get the mapping correct. Use least squares or SVD, but OpenCV works with RANSAC. | Should have some 10-50 corresponding pairs to get the mapping correct. Use least squares or SVD, but OpenCV works with RANSAC. | ||
=== | === Non rigid spatial warp === | ||
Thin plate spline, | |||
<math> | |||
(u,v) = f(x,y) | |||
</math> | |||
where | |||
<math> | |||
f(x,y) = a_1 + a_2 x + a_3 z + \sum_i w_i U(|p-p_i|) | |||
</math> | |||
and | |||
<math> | |||
U(r) = r^2 \log r | |||
</math> | |||
=== === | === === | ||
Revision as of 10:21, 15 May 2026
Introduction
-
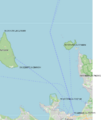
The map and some coordinates
-

The map shall be transformed to photo


The position of vessels on a photo.
Data acquisition
USE RTL-AIS, ship162 (https://github.com/xoolive/ship162) project and Python, with tape measure antenna.
Transform
Some ideas to generate the transformation. Full camera projection is not needed here.
Homology
The simplest;

Should have some 10-50 corresponding pairs to get the mapping correct. Use least squares or SVD, but OpenCV works with RANSAC.
Non rigid spatial warp
Thin plate spline, where and



