AIS visualization TASK: Difference between revisions
| Line 83: | Line 83: | ||
=== Vessel data === | === Vessel data === | ||
AIS Type 5 (Ship Static and Voyage Related Data) provides the core vessel identity and voyage information. The data items typically included are: | |||
* MMSI (Mobile Maritime Service Identity) and AIS version | |||
* Vessel name | |||
* Vessel type (ship type code) and, if available, cargo type | |||
* IMO number (where the vessel has one) | |||
* Call sign | |||
* Dimensions: length overall (LOA) and beam (and sometimes length between perpendiculars) | |||
* Ship’s flag (nation) and owner (where available in the data set) | |||
* Gross tonnage (GT) and net tonnage (NT) | |||
* Destination (voyage destination) | |||
* Estimated Time of Arrival (ETA) at destination | |||
* Draft (summer draft or latest reported draft) | |||
* Vessel status or navigational status (for example underway using engine, at anchor, etc) | |||
<syntaxhighlight lang="SQL"> | <syntaxhighlight lang="SQL"> | ||
Revision as of 17:01, 2 July 2026
Introduction
-
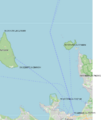
The map and some coordinates
-

The map shall be transformed to photo


The position of vessels on a photo.
Software
- rtl_ais -n -> parser -> database
- Ship162 is nice
ship162 --interactive rtlsdr:// - AIS-catcher https://github.com/jvde-github/AIS-catcher COULDN't get working
- GNU AIS is old, GNU radio is newer but rather heavy.
AIS Data format
My AIS data looks like following
AISSentence<!AIVDM,1,1,,A,147MT`00011i6jpR1JV@97nj0D1v,0*1E>
AISSentence<!AIVDM,1,1,,A,147>aD0P?w<tSF0l4Q@>4?wp0UrD,0*62>
AISSentence<!AIVDM,1,1,,B,347eHF5000QiHiHR0u;ooiFj2000,0*41>
AISSentence<!AIVDM,2,1,3,A,547GF<81AcKHE=`4001@58lt000000000000001J5@c;;uGa0@25CQ2D,0*50
!AIVDM,2,2,3,A,1@@000000000000,2*26>
AISSentence<!AIVDM,1,1,,A,147sn80000Qi9N4R1JV=r16n04HH,0*17>
AISSentence<!AIVDM,2,1,4,B,5482L002;29tE<iR221HDM@TpB2222222222220`1P>3540003l0E0DQ,0*35
!AIVDM,2,2,4,B,BO@AAkPH8888880,2*1D>
AISSentence<!AIVDM,1,1,,B,1480bf0P001i5A`R1IRP>gvt0d1t,0*62>
AISSentence<!AIVDM,1,1,,B,33ni`v5P00Qi5BpR1I1@6wwj0000,0*69>
AISSentence<!AIVDM,1,1,,A,402`m?1vaT36WQieB8R3TQ?02L5V,0*53>
so there are extra texts, like AISSentence< which needs to be removed. The multipart message is partly combined already. The first 1 or 2 describe how many parts the message is divided into, A and B describe the channel, and the last part is the message.
The cleaned AIS data looks like:
!AIVDM,1,1,,A,147MT`00011i6jpR1JV@97nj0D1v,0*1E
!AIVDM,1,1,,A,147>aD0P?w<tSF0l4Q@>4?wp0UrD,0*62
!AIVDM,1,1,,B,347eHF5000QiHiHR0u;ooiFj2000,0*41
!AIVDM,2,1,3,A,547GF<81AcKHE=`4001@58lt000000000000001J5@c;;uGa0@25CQ2D,0*50
!AIVDM,2,2,3,A,1@@000000000000,2*26
!AIVDM,1,1,,A,147sn80000Qi9N4R1JV=r16n04HH,0*17
!AIVDM,2,1,4,B,5482L002;29tE<iR221HDM@TpB2222222222220`1P>3540003l0E0DQ,0*35
!AIVDM,2,2,4,B,BO@AAkPH8888880,2*1D
!AIVDM,1,1,,B,1480bf0P001i5A`R1IRP>gvt0d1t,0*62
!AIVDM,1,1,,B,33ni`v5P00Qi5BpR1I1@6wwj0000,0*69
!AIVDM,1,1,,A,402`m?1vaT36WQieB8R3TQ?02L5V,0*53
https://open-ais.org/docs/Data-Architecture/
https://gpsd.gitlab.io/gpsd/AIVDM.html
Data acquisition
USE RTL-AIS, ship162 (https://github.com/xoolive/ship162) project and Python, with tape measure antenna.
Or GNU AIS saves the data to local MySQL server.
rtl_ais
Sqlite3 database
CREATE TABLE ais_data (
    id INTEGER PRIMARY KEY AUTOINCREMENT,
    ts DATETIME DEFAULT CURRENT_TIMESTAMP,
    mmsi INTEGER,
    msg_type INTEGER,
    lat REAL,
    lon REAL,
    sog REAL,
    cog REAL,
    heading REAL,
    shipname TEXT,
    raw TEXT
);
Use it eg from the command line: sqlite3 ais.db "SELECT COUNT(*) FROM ais_data;".
The following code AIS Save to database using Python will save the data.
Vessel data
AIS Type 5 (Ship Static and Voyage Related Data) provides the core vessel identity and voyage information. The data items typically included are:
- MMSI (Mobile Maritime Service Identity) and AIS version
- Vessel name
- Vessel type (ship type code) and, if available, cargo type
- IMO number (where the vessel has one)
- Call sign
- Dimensions: length overall (LOA) and beam (and sometimes length between perpendiculars)
- Ship’s flag (nation) and owner (where available in the data set)
- Gross tonnage (GT) and net tonnage (NT)
- Destination (voyage destination)
- Estimated Time of Arrival (ETA) at destination
- Draft (summer draft or latest reported draft)
- Vessel status or navigational status (for example underway using engine, at anchor, etc)
CREATE TABLE IF NOT EXISTS vessels(
    id INTEGER PRIMARY KEY AUTOINCREMENT,
    vessel_name TEXT NOT NULL,
    vessel_type TEXT NOT NULL,
    length REAL,
    breadth REAL,
    draft REAL,
    tonnage REAL,
    registration_number TEXT,
    mmsi INTEGER UNIQUE
);
Transform
Some ideas to generate the transformation. Full camera projection is not needed here.
The latitude/longitude scale is not a linear measure. Thus, to a conversion to metric scale is better. UTM projection (pyproj) or using a local tangent plane. The UTM projection works better for this 10-20 km distances.
Plan
The coordinate system of the map is WGS84 EPS:4326 to EPSG:32635.
The mapping and ideas
- Get the mapping ship's GNSS coordinates to image coordinates
- Convert GNSS coordinates to UTM and then to metric points. Change the origin such that the metric numbers are reasonable.
- Find the corresponding pixels at the photo image.
- Compute homography matrix
- For testing purposes plot the GNSS value on the map.
- Create other homology mapping between GNSS coordinates and the map
- Create other homology mapping between GNSS coordinates and the map
UTM projection
The latitude/longitude scale is not a linear measure. Thus, to a conversion to metric scale is better. UTM projection (pyproj) or using a local tangent plane. The UTM projection works better for this 10-20 km distances.
# WGS84 GPS -> UTM zone 35N
transformer = Transformer.from_crs(
    "EPSG:4326",
    "EPSG:32635",
    always_xy=True
)


gps_points = np.array([
[59.4480442,24.7727679],
[59.4720746,24.7267166],
[59.5183884,24.7962952],
[59.5226077,24.5841614],
[59.5770763,24.7294084]
])

utm_points = []
for lon, lat in gps_points:
    x, y = transformer.transform(lon, lat)
    utm_points.append([x, y])

x0, y0 = utm_points[2]
local_points = []
for x, y in utm_points:
    local_points.append([x - x0, y - y0])

print(local_points)
Homology
https://docs.opencv.org/4.x/d9/dab/tutorial_homography.html
The simplest;

Should have some 10-50 corresponding pairs to get the mapping correct. Use least squares or SVD, but OpenCV works with RANSAC.
Non rigid spatial warp
Thin plate spline, where and



