Lidar data visualization
From wikiluntti
Introduction
Use Lidar data, post analyze it with Python/ Pandas? and use Blender to visualize it.
Theory
The free Lidar data set are available e.g. at Opentopography.org. We use both, the Tif data and LAS data of IT-Ren, Fluxnet site
LAS File Format
LAS@Wikipedia how to print lidar file format las
a) Headers.
b) VLR: Variable Length Record. Include 1) header and 2) payload.
c) Point records. Different point formats 0-10.
LAS in Python

[Laspy Github] [LasPy]
import numpy as np
import pylas

las = pylas.read( fname )
#np.all(las.user_data == las['user_data'])

point_format = las.point_format
print( point_format )
print( point_format.id )
print( list(point_format.dimension_names) )

from mpl_toolkits import mplot3d
import matplotlib.pyplot as plt
fig = plt.figure()
ax = plt.axes(projection='3d')

N=5000
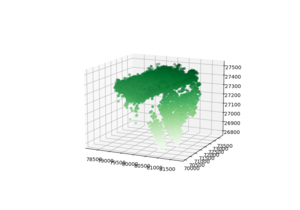
ax.scatter3D(las.X[:N], las.Y[:N], las.Z[:N], c=las.Z[:N], cmap='Greens');
Lidar Cloud Data to Blender Mesh
Blender need mesh, also nodes, faces and vertices. Thus, the data cloud need to be converted to mesh data. We use the Rolling Ball algorithm of Open3d package.
how do i convert a 3d point cloud ply into a mesh with faces and vertices