Secondary level maths with graphics and animations using p5js
Introduction
Introduce the math concepts taught in secondary school (pupils age is 15/16 - 18/19) using highly motivating scheme. Can be described as experimental mathematics, coding of art, and introduction to algorithms. Topics:
- 1 Trigonometric functions
- 2 Lines
- 3 Parabolas
- 4 Higher order polynomials (Bezier)
- 5 Circles and ellipses
- 6 Derivatives
Animations and colors are the idea. Difficulties are the following
- A A Basic + basic animations
- B Animations (Colors, lot of movement)
- C The (math) arts
Colors are difficult: Use some redefined color schemes from some www page.
TODO
Something to do:
- 1. Check the maths / phys / chem curriculum
- 1. Write a short description what should be learned
- 1. Adjust these examples to those
- 2. Create more exercises into tasks
- 2. Choose the suitable tasks
- 2. Create more tasks according to the curriculum
- 2. Include math topics in these?
Which course a given exercise is suitable for.
Create the mathematical framework with suitable exercises (and solutions?).
The idea:
- Introduction and tutorial together with curriculum including some 25 lectures.
- Basic shapes (square, ellipse, circle, triangle. . . )
- Colors
- Animation with sinusoidal motion
- The Arts and Maths
- (The maths/ or methodological framework)
Generative art
What is
- Music, Visual Art, Software Art, Architecture, Literature, Live Coding
- Experimental nature
History
People:
- Tim Holman
- Line
- Tiling: Maze; Randomly from vertical/ horizontal lines. Curves;
- Displacement: Maanjäristysgraafi.
- Bezier Curve: Start, end and two control points.
- Repetition
- Philip Galanter
- Margaret Boden
- Ernest Edmonds
https://www.youtube.com/watch?v=4Se0_w0ISYk
How To Draw With Code | Casey Reas: https://www.youtube.com/watch?v=_8DMEHxOLQE
- Emergence: You put some simple rules together and something comes out of that which is something unexpected and moves beyound those rules.
- Compare to musicians, notes and performing:
- The boundary between a program and an object
Theory
UPDATE: Framecount (https://www.geeksforgeeks.org/p5-js-framecount-variable/)
Sine curve
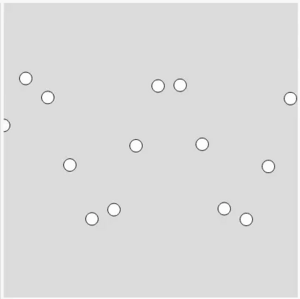
Coding: background(color), CreateCanvas(widthX, widthY), ellipse( x, y, widthX, widthY), for (let i=0; i<20; i++){}, let, print(). Global variables!
Maths: Sine, animated sine
The minimal setup for drawing an animated sine curve.
let t = 0
function setup() {
  createCanvas(400, 400);
}

function draw() {
  background(220);

  t += .02
  for (let x=0; x<20; x++){
    ellipse( 30*x, 200+ 100*sin(x+t), 17, 17)
    //print( sin(t) )
  }
}
Exercises
- Note that part of sine function is clipped.
- How many points are missing?
- Adjust the ellipse() function such that no clipping happens OR adjust the for function.
Connected Sine Curve
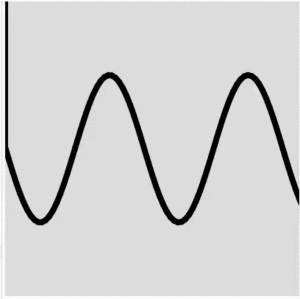
Code: line( x0, y0, x1, y1), stroke(color), strokeWeight(width)
function setup() {
  createCanvas(400, 400);
}

function draw() {
  background(220);

  let yPrev = 0
  let xPrev = 0
  let x = 0
  let y = 0

  stroke('black')
  strokeWeight(8)

  for (let i=0; i<90; i++){
    x = 5*i
    y = 200 + 100*sin(x/30)

    line( xPrev, yPrev, x, y)

    xPrev = x
    yPrev = y
  }
}
Exercises
- Draw the x and y axis
- Set tick marks
- The beginning is wrong: Correct that.
- How many extra points are calculated but not shown on the image?
- Animate the curve as shown in Figure (after clicking it).
Connected Sine Curve using arrays and functions
Coding: function, push(), []
let t = 0;
let xarray = [] //Use global functions for these;
let yarray = [] //No need to redeclare these

function setup(){
  createCanvas(400, 400);
  for (let i=0; i<400; i++){
    xarray.push(i);
  }
}

function sineWave(x, A, w, t, y0){
  let y = []

  for (let i=0; i<x.length; i++){
    y.push( y0 + A*sin(w*(x[i] + t) ) );
  }
  return y
}

function draw(){
  background(220);
  stroke('black');
  t += 1
  yarray = sineWave( xarray, 100, 0.05, t, 200 );
  for (let i=1; i<yarray.length; i++){
    line( xarray[i-1], yarray[i-1], xarray[i], yarray[i] )
  }
}
Superposition (sum) of multiple Sine Waves
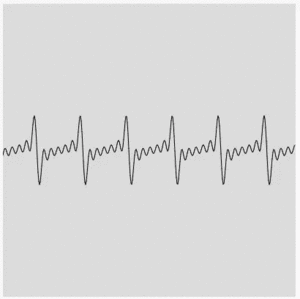
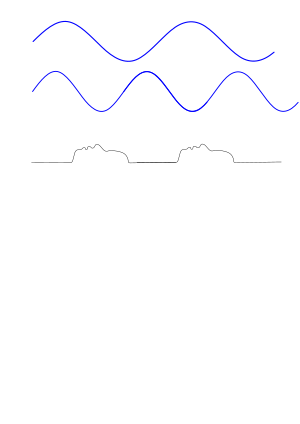
The use of functions. Use functions to calculate the values, and plot it in the main program.
let t = 0;
let xarray = []
let yarray = []
let ytemp = []

function setup(){
  createCanvas(400, 400);
  for (let i=0; i<400; i++){
    xarray.push(i);
    yarray.push(0);
  }
}

function sineWave(x, A, w, t){
  let y = []

  for (let i=0; i<x.length; i++){
    y.push( A*sin(w*(x[i] + t) ) );
  }
  return y
}

function draw(){
  background(220);
  stroke('black');
  t += 1

  for (let i=0; i<yarray.length; i++){
    yarray[i]=0;
  }

  for (let i=0; i<7; i++){  //Create waves with different frequency and amplitude
    ytemp = sineWave( xarray, 10, 0.1*i, t, 100 );
    for (let i=0; i<yarray.length; i++){
      yarray[i] = yarray[i] + ytemp[i]  //Count the different waves together
    }
  }
  for (let i=0; i<yarray.length; i++){
    yarray[i] = 200 + yarray[i]  //Adjust the zero point
  }

  for (let i=1; i<yarray.length; i++){
    line( xarray[i-1], yarray[i-1], xarray[i], yarray[i] )
  }
}
Exercises
- Add random
- Try to create the following image
- Check what is FFT
Animate sine curve drawing
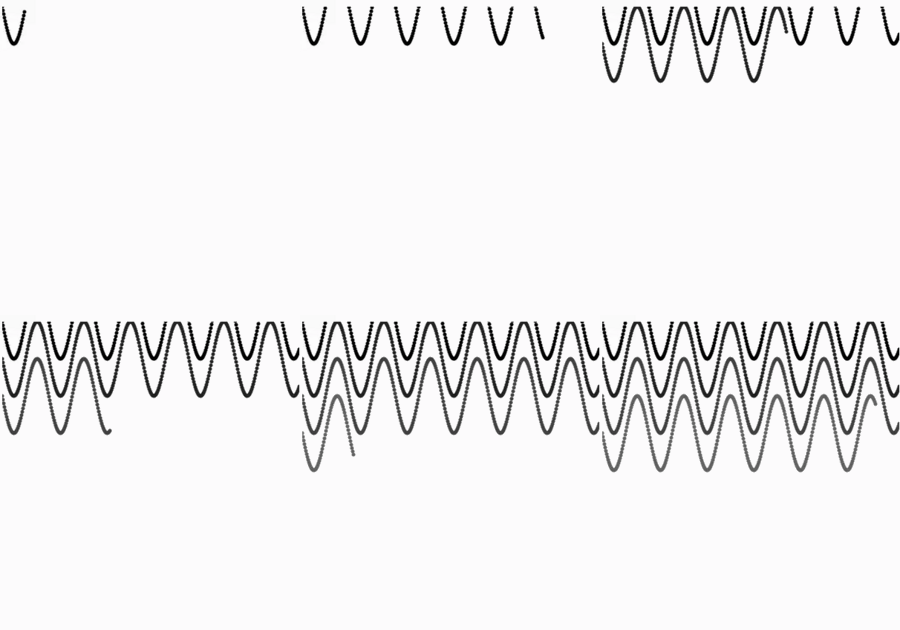
let t = 0
let n = 0
function setup() {
  createCanvas(400, 400);
}

function y(t){
  return( 50*sin(t/10))
}

function draw() {
  stroke(255*n/8)
  strokeWeight(5);
  translate(0, 50*n)

  point( t, y(t));
  t++
  if (t>width){
    t = 0;
    n++
    if (n>9){
      n = 0
      clear()
    }
  }
}
Rotating 3d Axis
Code: rotateX(angle), WEBGL
Math: Rotations
The space of 3d maths is different from that of 2d. So, we need to think about the origin and span of the directions: The origin is in the middle of the canvas. The x-axis goes left-to-right, y-axis goes up-to-down, and the z-axis goes from further-to-closer.
https://p5js.org/learn/getting-started-in-webgl-coords-and-transform.html
function setup(){
  createCanvas(400, 400, WEBGL);
}

function draw(){
  background(220);

  rotateX(millis()/5000)
  rotateY(millis()/5000)
  rotateZ(millis()/5000)
  //box()

  stroke('red')
  line(0,0,0, 100,0,0)
  stroke('green')
  line(0,0,0, 0,100,0)
  stroke('blue')
  line(0,0,0, 0,0,100)
  //}
}
3d Sine wave structures
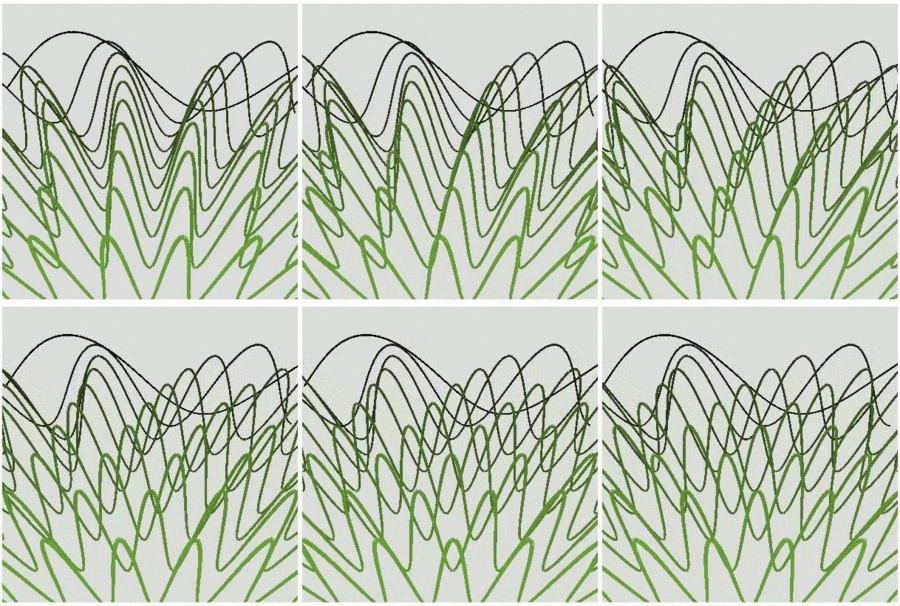
Code camera(),
Math: Rotations,
let t = 0;
let xarray = [] //Use global functions for these;
let yarray = [] //No need to redeclare these
//yarray could be 2d array to contain all the data

function setup(){
  createCanvas(400, 400, WEBGL);
  for (let i=0; i<700; i++){
    xarray.push(i-350);
  }
}

function sineWave(x, A, w, t, y0){
  let y = []

  for (let i=0; i<x.length; i++){
    y.push( y0 + A*sin(w*(x[i] + t) ) );
  }
  return y
}

function draw(){
  background(220);
  strokeWeight(4)

  camera(00, -300, 300 );

  t += 1
  for (let n=1; n<20; n++){
    yarray = sineWave( xarray, 100, 0.01*n, n*t/2, 0 );
    for (let i=1; i<yarray.length; i++){
        stroke( 10*n,15*n,5*n, n)
        let z = 50*n-300
        line( xarray[i-1], yarray[i-1], z , xarray[i], yarray[i], z )
    }
  }
}
spirograph
Lissajous figure
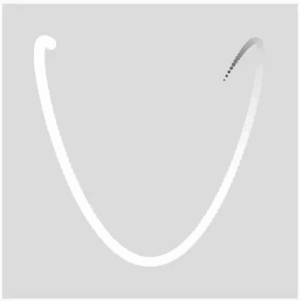
Coding: noStroke(), fill( 255), circle(x,y,s), p5.Vector(x,y),
Math: log(i+1)
We use log() function in determining the color of the trail, because it is softer, it doesn't change that fast.
The coordinates (or the notation of x-axis) on the computer screen are different than conventionally used in maths. So, the image is rotated.
let t = 0
let trail = []
let N = 150
function setup() {
  createCanvas(400, 400);
  noStroke();
}

function draw() {
  background(220);

  let s = 15
  t += .01
  let x = 200 + 150*sin(3*t)
  let y = 200 + 150*cos(5*t+3.14159/3)
  fill( 255)
  circle(x,y,s)

  trail.push( new p5.Vector(x,y) )
  if (trail.length > N){
    trail.shift();
  }

  for (let i = 0; i<trail.length; i++){
    let p = trail[i]
    fill( 255*log(i+1)/4 )
    circle( p.x, p.y, s*(log(i+1))/5 )
  }
}
Exercises
- Calculate how many points are needed such that the whole figure is shown, and use that.
- The fill color in the last loop is only approximate. Calculate that to be exact according to the number N.
Spiral
let t = 0
let trail = []
let N = 1550
function setup() {
  createCanvas(400, 400);
  noStroke();
}

function draw() {
  background(220);

  let s = 15
  t += .01
  let x = 200 + 5*t*sin(2*t)
  let y = 200 + 5*t*cos(2*t)
  fill( 255)
  circle(x,y,s)

  trail.push( new p5.Vector(x,y) )
  if (trail.length > N){
    trail.shift();
  }

  for (let i = 0; i<trail.length; i++){
    let p = trail[i]
    fill( 25*log(i+1)/4 )
    circle( p.x, p.y, 2 )
  }
}
Exercises
- Make the spiral logarithmic: The radius is changing faster.
Lissajous figures

Coding: Arrays, background(), fill(), noStroke(), p5.Vector, translate()
Maths:
sine, cosine
let t = 0
let s = 2
let X = []
let pi = 3.14159
deltas = [0, pi/4, pi/2, 3*pi/4, pi]
ratios = [new p5.Vector(1,1), new p5.Vector(1,2), new p5.Vector(1,3),
          new p5.Vector(2,3),
          new p5.Vector(3,4), new p5.Vector(3,5),
          new p5.Vector(4,5), new p5.Vector(5,6) ]
let N = deltas.length*ratios.length

function setup() {
  createCanvas(400, 500);
  noStroke();
  background(220);
}

function lissajous(wx, wy, t, delta){
  let x = 15*sin(wx*t+delta);
  let y = 15*cos(wy*t);
  return new p5.Vector(x,y);
}

function draw() {
  stroke('black')
  t += .01

  translate(4*80+35,30)
  for (r=0; r<ratios.length; r++){
    translate( -5*80, 50)

    for (d=0; d<deltas.length; d++){
      fill( 255)
      translate(80,0)
      X = lissajous( ratios[r].x, ratios[r].y, t, deltas[d])
      circle(X.x,X.y,3)
    }
  }
}
Exercises:
- Make it colorful.
- Use colorful trail instead of black dots.
Moving rods
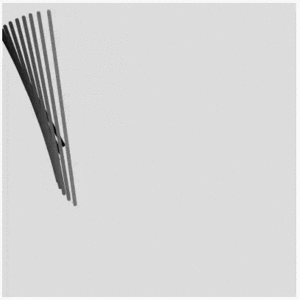
Coding: p5.Vector,
Math:
let t = 0
let X1 = new p5.Vector();
let X2 = new p5.Vector();
let N = 10;
function setup() {
  createCanvas(400, 400);
}

function posX1(t){
  let x = 120*sin(t/10) + 20*sin(t/5)
  let y = 100*cos(t/10)
  return new p5.Vector(x,y)
}
function posX2(t){
  let x = 200*sin(t/10) + 2*sin(t)
  let y = 200*cos(t/20) + 20*cos(t/12)
  return new p5.Vector(x,y)
}

function draw() {
  background(220);

  strokeWeight(5);
  translate(width/2, height/2 )

  for (let i=0; i<N; i++){
    X1 = posX1(t+i);
    X2 = posX2(t+i);
    stroke(128*i/N)
    line( X1.x, X1.y, X2.x, X2.y);
  }
  t++
}
Exercises:
A colorful 3D sphere with circles
Particle system with wavy movement
Control a p5.js animation with sliders
Landscape with perlin noise
Bezier curves
Parabola using Straight lines
Coding:
Maths: Focus point
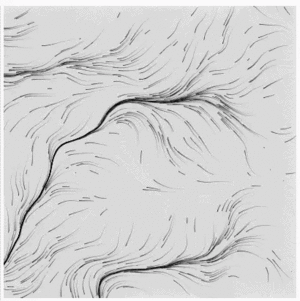
How to make a flow field
Perlin flow fields
Coding:
Maths: Noise, Perlin noise
let particles = [];
let N = 1000;
const noiseScale = 0.01

function setup() {
  createCanvas(400, 400);
  for (let i=0; i<N; i++){
    particles.push( new p5.Vector( random(width), random(height)))
  }
}

function onScreen(v){
  return v.x >= 0 && v.x <= width && v.y >= 0 && v.y <= height
}

function draw() {
  background(220, 10);

  for (let i=0; i<N; i++){
    point( particles[i].x, particles[i].y );

    let n = noise( noiseScale*particles[i].x, noiseScale*particles[i].y);
    let a = 2*PI*n
    particles[i].x += cos(a);
    particles[i].y += sin(a);

    if (!onScreen(particles[i])){
      particles[i].x = random(width);
      particles[i].y = random(height);
    }
  }
}
Exercises:
3D particle explosions
Simple sine wave animation
Circular perlin noise
2D Diffusion
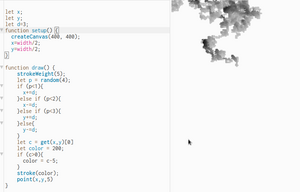
Brownian motion.
Coding: get(x,y)
Maths: Brownian motion, Random
Exercises:
- Make non overlapping diffusion
DLA: Diffusion-limited aggregation
Physics: Lichtenberg model.
Evenly Spaced Stars Around a Circle
Coding: translate()
Maths: sine and cosine, unit circle,
let r = 150
let pi = 3.14159
let t = 0
N = 5
function setup() {
  createCanvas(400, 400);
}

function draw() {
  background(220);
  translate(width / 2, height / 2);
  noFill();
  circle(0,0,2*r);
  strokeWeight(4);

  t += 0.02;
  for(let i=0; i<N; i++){
    let x = r*sin(t+2*pi*i/N);
    let y = r*cos(t+2*pi*i/N);
    stroke('red')
    circle(x,y, 100+200*abs(sin(t)**2))
  }
}
Recursive trees
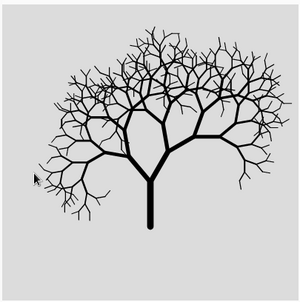
Coding: push(), pop(),
Maths:
function setup() {
  createCanvas(400, 400);
  angleMode(DEGREES)

  noLoop();
}

function branch(len){
  push()
  if (len>10){
    strokeWeight( map(len, 10, 100, 1, 15))
    line(0,0,0,-len)
    translate(0,-len)
    rotate(30)
    branch(random(0.7, 0.9)*len)
    rotate(-70)
    branch(random(0.7, 0.9)*len)
  }
  pop()
}

function draw() {
  background(220);

  translate( width/2, height*3/4);
  branch(60)
}
Exercises:
- Add leafs
- Change the branch length to a random value
Billiard ball
Coding: Classes, constructor()
Maths: Simple (Euler) integration
let t=0;
let ball;

class Ball {
  constructor() {
    this.x = 100;
    this.y = 200;
    this.speedX = 5;
    this.speedY = 4;
    this.diameter = 10
  }
  move() {
    this.x += this.speedX;
    this.y += this.speedY;
  }
  turn() {
    if (this.x < 0) {
      this.x = 0;
      this.speedX = -this.speedX;
    }
    if (this.x > width - this.diameter/2) {
      this.x = width - this.diameter/2;
      this.speedX = -this.speedX;
    }
    if (this.y < 0) {
      this.y = 0;
      this.speedY = -this.speedY;
    }
    if (this.y > width - this.diameter/2) {
      this.y = width - this.diameter/2;
      this.speedY = -this.speedY;
    }
}
  display() {
    ellipse(this.x, this.y, this.diameter, this.diameter);
  }
}

function setup() {
  createCanvas(400, 400);
  ball = new Ball;
}

function draw() {
  background(220);

  t += 0.1
  ball.turn();
  ball.move();
  ball.display();
}
Exercises:
- Draw the trajectory. Can you fill the table?
- Add more balls with random speeds
- Add gravitation
- Change color when hits the border
Bouncing damped ball
let t=0;
let ball;

// Ball class
class Ball {
  constructor() {
    this.x = 100;
    this.y = 100;
    this.g = 0.5;
    this.speedX = 5;
    this.speedY = 4;
    this.diameter = 10
  }
  move(t) {
    this.x += this.speedX;
    this.speedY += this.g * t
    this.y += this.speedY;
  }
  turn() {
    if (this.x < 0) {
      this.x = 0;
      this.speedX = -this.speedX;
    }
    if (this.x > width - this.diameter/2) {
      this.x = width - this.diameter/2;
      this.speedX = -this.speedX;
    }
    if (this.y < 0) {
      this.y = 0;
      this.speedY = -this.speedY;
    }
    if (this.y > width - this.diameter/2) {
      this.y = width - this.diameter/2;
      this.speedY = -this.speedY;
    }
  }
  display() {
    ellipse(this.x, this.y, this.diameter, this.diameter);
  }
}

function setup() {
  createCanvas(400, 400);
  ball = new Ball;
}

function draw() {
  background(220);

  t += 0.1
  ball.turn();
  ball.move(t);
  ball.display();
}
Exercises
- Add deformations
- Add end statement: End if bounce is too small.
- Add more balls
- Let the ball follow mouse
3D realistic, recursive trees
Straight Lines shows Curve
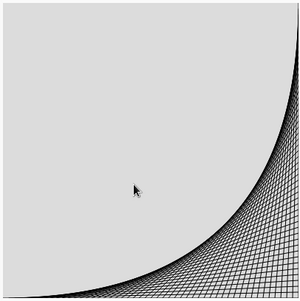
Coding:
Maths:
let N = 50;
function setup() {
  createCanvas(400, 400);
}

function draw() {
  background(220);
  for (let i=0; i<=N; i++){
    line( width*i/N, height, width, width*(N-i)/N )
  }
}
Exercise:
Lines and Displacements
(Tim Holman)
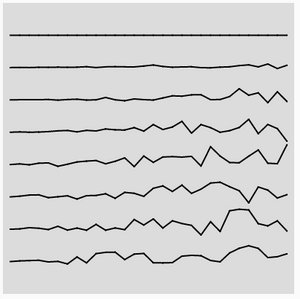
Coding: frameRate
Maths Lots of, Gaussian Random Numbers, Arithmetic Series,
let N = 8;
let Nx = 30;
let y = []

function setup() {
  createCanvas(400, 400);
  frameRate(0.5);
  for (let i=0; i<Nx; i++){
    y.push(0)
  }
}

function draw() {
  background(220);
  strokeWeight(2);

  for (let i=0; i<N; i++){
    let yh = (i+1)*height/(N+1)
    let xprev = 10;
    for (let j=1; j<Nx; j++){
      y[j] = 20*j*randomGaussian(-1,1)/Nx/N*i //*((i)/N)
      let x = 10 + (width-20)*j/(Nx-1)
      point( x, yh+y[j] )
      line( xprev, yh+y[j-1], x, yh+y[j]  )
      xprev = x
    }
  }

}
Exercises:
- Change line command to Curve.
Curves and Displacements
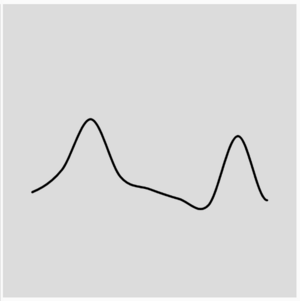
Coding: Curve()
Maths: Bezier curve, derivative
let N = 10;
function setup() {
  createCanvas(400, 400);
  frameRate(0.5)
  noFill();
}

function draw() {
  background(220);
  strokeWeight(3);

  beginShape();
  for (let i=0; i<=N; i++){
    curveVertex(width*i/N,height/2 + random(-80,80));
  }
  endShape();
}
Exercises:
Maze generator
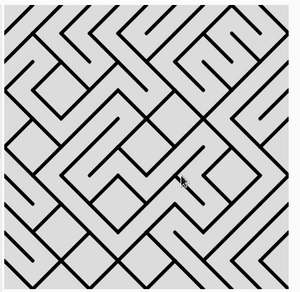
Coding:
Maths:
let N = 10
let p = 0.5
function setup() {
  createCanvas(400, 400);
  frameRate(0.5);
}

function draw() {
  background(220);
  strokeWeight(5);

  for (let i=0; i<N; i++){
    for (let j=0; j<N; j++){
      //point( i*width/N, j*width/N, 5)

      if (p>random(1)){
        line( i*width/N, j*width/N, (i+1)*width/N, (j+1)*width/N);
      }else{
        line( (i+1)*width/N, j*width/N, i*width/N, (j+1)*width/N);
      }
    }
  }
}
Exercises:
Recursive Squares
Electromagnetic field lines
Complex sine waves & polar coordinates
Bouncing circle(s)
Exercises
- Add more balls
- Let the balls bounce from each other
- Add gravitation
- Add wind (simple flow)
Bouncing and rotating circle
Advanced blur effect
Rotating squares
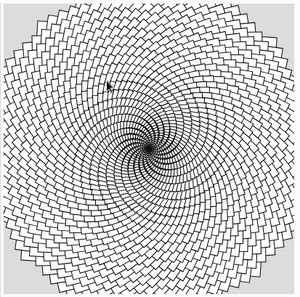
Coding:
rectMode( CENTER ),
Square()
Maths: Angle, Radians, Rotation,
function setup() {
  createCanvas(400, 400);
  rectMode( CENTER )
}

function draw() {
  background(220);
  translate(width / 2, height / 2);

  for (i=400; i>0; i--){
    rotate(-0.3); // in Radians
    translate(0,0);
    square(0,0,i/1.2);  //Here, because the origin is shifted
  }
}
Rotating Squares II
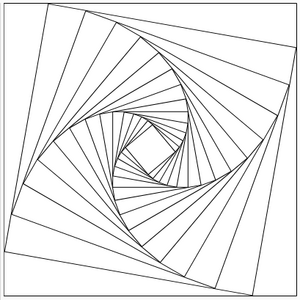
Coding:
Maths: Geometric series, rotation angle and geometric coefficient.
function setup() {
  createCanvas(400, 400);
  rectMode( CENTER )
}

function draw() {
  background(220);
  translate(width / 2, height / 2);

  square( 0,0, width-1);

  for (let i = 1; i<15; i++){
    rotate( radians(10) );
    square( 0,0, 0.86**i*(width-1) ) ;
  }
}
Rotated Squares
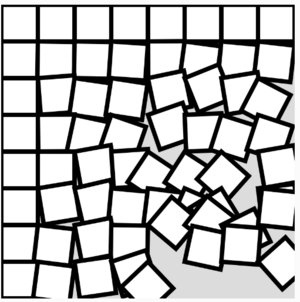
(Tim Holman)
Coding: Rotate(), Translate()
Maths: Arithmetic Series
let N = 8;
let alpha
function setup() {
  createCanvas(400, 400);
  rectMode(CENTER);
  frameRate(1)
}

function draw() {
  background(220);
  strokeWeight(6);

  for (let i=0; i<N; i++){
    for (let j=0; j<N; j++){
      alpha = random(-0.2, 0.2)
      rotate(i*j*alpha/5)
      square(width/N/2, width/N/2, width/N);
      rotate(-i*j*alpha/5)
      translate(width/N, 0);
    }
    translate(-width, width/N);
  }
}
Exercises:
Moire Pattern
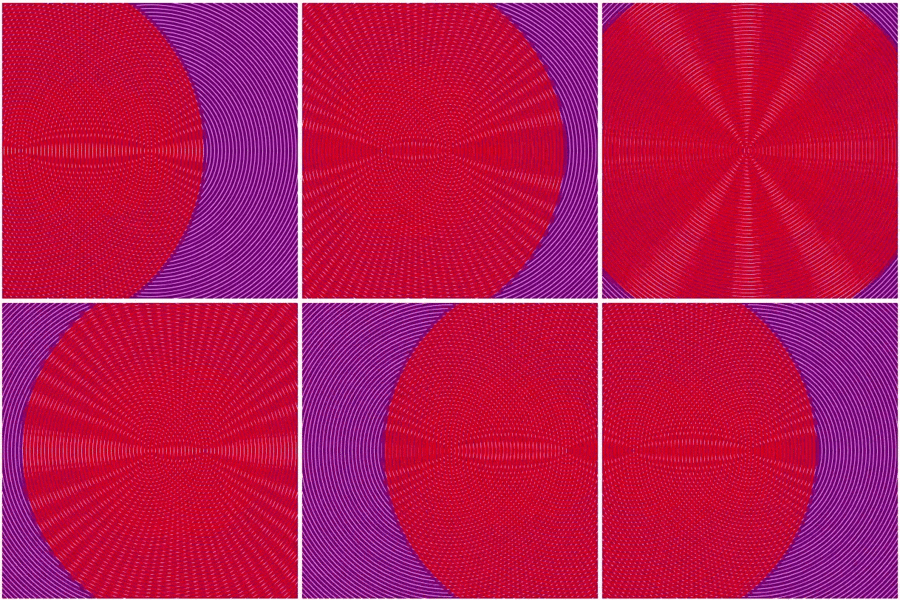
Coding:
Maths: https://www.youtube.com/watch?v=cvWF_Q5-Kt8
let x = 0
function setup() {
  createCanvas(400, 400);
  noFill();
}

function draw() {
  background(220);

  x+=1
  for (let i=0; i<1000;i+=10){
    stroke('Purple');
    strokeWeight(4);
    circle( 200, 200, i)

    stroke('red');
    strokeWeight(3);
    circle( x, 200, 500-i)
  }

  if (x>width){
    x=0
  }
}
Exercises:
- Try with different stroke weights.
- Let the red circle come from the left side and vanish to the right side.
- Experiment with different directions of the red circle.
Tim Holman - Generative Art Speedrun CSSConf Australia
"A Box of Chaos: The Generative Artist's Toolkit" by Benjamin Kovach Strange Loop
Video Effects with Seriously.js - p5.js Tutorial The Coding Train
The random() Function - p5.js Tutorial The Coding Train
createGraphics() - p5.js Tutorial The Coding Train
Warped Circle
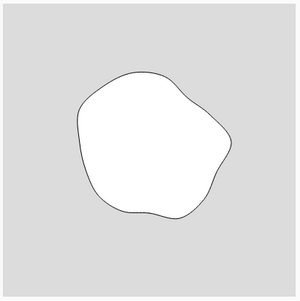
Code: curveVertex()
Maths: Derivative, tangent
let N = 15
let x0, y0
let r = 100
let x = [];
let y = [];

function setup() {
  createCanvas(400, 400);
  x0=width/2;
  y0=height/2;

  for (let i=0; i<N; i++){
    let R = (1 + (2*noise(i) - 1)*0.2)*r
    x.push(x0+R*sin(TWO_PI/(N)*i));
    y.push(y0+R*cos(TWO_PI/(N)*i));
  }
  x.push( x[0] )
  y.push( y[0] )
  x.push( x[1] )
  y.push( y[1] )
  x.push( x[2] )
  y.push( y[2] )
  //curveVertex: 1st and last are control points. Thus, in the circular shape 1st is last and last is first.
}

function draw() {
  background(220);

  beginShape();
  for (let i=0; i<x.length; i++){
    curveVertex(x[i], y[i]);
    //circle( x[i], y[i], 10)
  }
  endShape();

}
Exercises:
- Create animated
- Use random() or noise() functions
Warping circle
Code: Class(),
Maths: Polar coordinates,
let N = 5;
let circle;

class Warped{
  constructor(){
    this.x0 = width/2
    this.y0 = height/2
    this.r = 130
    this.R = [];
    this.x = [];
    this.y = [];
    for (let i=0; i<N; i++){
      this.R[i] = (1 + (2*noise(i) - 1)*0.2)*this.r
      this.x.push(this.x0+this.R[i]*sin(TWO_PI/(N)*i));
      this.y.push(this.y0+this.R[i]*cos(TWO_PI/(N)*i));
    }
    this.x.push( this.x[0] )
    this.y.push( this.y[0] )
    this.x.push( this.x[1] )
    this.y.push( this.y[1] )
    this.x.push( this.x[2] )
    this.y.push( this.y[2] )
  }

  reshape(t){
    for (let i=0; i<N; i++){
      this.R[i] += (random(2) - 1)*0.03*this.r*dt
      this.x[i]= this.x0+this.R[i]*sin(TWO_PI/(N)*i);
      this.y[i]= this.y0+this.R[i]*cos(TWO_PI/(N)*i);
    }
    this.x[N] = this.x[0]
    this.y[N] = this.y[0]
    this.x[N+1] = this.x[1]
    this.y[N+1] = this.y[1]
    this.x[N+2] = this.x[2]
    this.y[N+2] = this.y[2]
  }

  draw(){
    beginShape();
    for (let i=0; i<this.x.length; i++){
      curveVertex(this.x[i], this.y[i]);
    }
    endShape();
  }
}

function setup() {
  createCanvas(400, 400);
  circle = new Warped;
}

function draw() {
  background(220);

  dt = 0.2;
  circle.reshape(dt);
  circle.draw();
}
Exercises:
Polar Coordinates - p5.js Tutorial The Coding Train
The Night Sky with stars
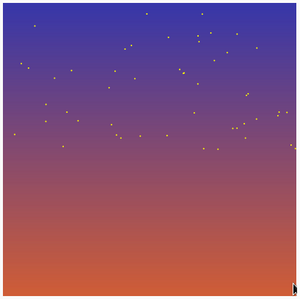
Codeː map(), lerpColor(), stroke(), line(), random()
Mathː Gradient (derivative)
function setup() {
  createCanvas(400, 400);
  frameRate(1);
}

function setGradient(c1, c2) {
  noFill();
  for (let i = 0; i <= height; i++) {
    let inter = map(i, 0, height, 0, 1);
    let c = lerpColor(c1, c2, inter);
    stroke(c);
    line(0, i, width, i);
  }
}

function draw() {
  background(220);

  let cZenith = color(0, 0, 153);
  let cHorizon = color(204, 51, 0);
  setGradient(cZenith, cHorizon);

  noStroke();
  for (let i = 0; i < 50; i++) {
    let x = random(width);
    let y = random(height-200);

    fill(255, 255, 0);
    ellipse(x, y, 2, 2);
  }
}
Exercises:
- Make shooting stars
- Let the Sun rise (or descent)
- Make the shooting star to follow a parabola path.
Lightning Algorithm
By 2D Brownian motion.
See https://zhenyanghua.github.io/2021/09/implement-the-lightning-algorithm/
Coding Challenge #53: Random Walker with Vectors and Lévy Flight The Coding Train
Sol LeWitt Translator: Wall Drawing #118 Mitchell Chan
Creative Coding in p5.js - GitHub Satellite 2020
Generative Plants Demo - Custom L-System Tool in P5.js TheBuffED
p5.js Tutorium (MS Paint Clone, Audio Equalizer Boilerplate) Felix Tesche
PROGRAMMING POSTERS TUTORIAL #1 tim rodenbröker creative coding
Creative Coding = unexplored territories | Tim Rodenbröker | TEDxUniPaderborn TEDx Talks
Processing Tutorial - Programming Posters (Creative Coding in the realms of Graphic Design) tim rodenbröker creative coding
Particles Effect With P5.js Traversy Media
Exploring generative spaces: a quickstart to generative art - GitHub Universe 2020 GitHub
Creative Coding Art Tutorial | How To Code Spiral Generative Art in Processing
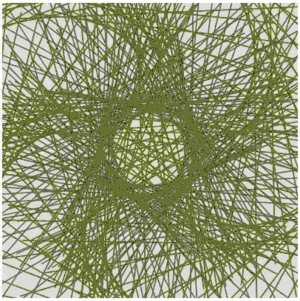
Coding:: map(),
Maths:
linear
let color;
let angle;
let size;
function setup() {
  createCanvas(400, 400);
  smooth();
  color = random(0,255);
  angle = random(0.1, 30);
  size = random(0.25, 3)
}

function draw() {
  background(220);
  translate( width/2, height/2)

  let wave = sin(radians(frameCount));
  let w = wave*map( mouseX, 0, height, 1500,0);
  for (let i=0; i<500; i++){
    rotate(angle);
    line(200,i-w/2,-200, i++);
    strokeWeight(map(wave, -1,1,0.5, size ))
    stroke(color)
    line(-200,-i+w,150, i++);
    stroke(color, color, 0)
    line(-200,i-w,200, i++);
  }
}
Exercises:
Art Now Coding
Jumping Into Generative Code Art (p5.js) Max Mitchell
Learn creative coding with JavaScript Codecademy
Adding fonts to p5.js using Google Matthew Boyle
How to export frames (to make an animated GIF loop) from p5.js Golan Levin
Clickable Mandelbrot Fractal
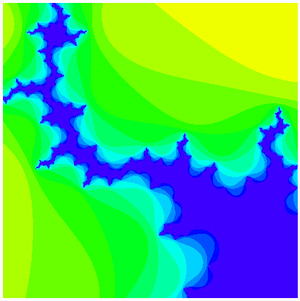
Code: HSV colors, loop(), redraw(), map(), noLoop(), mouseClicked(),
Maths: Complex numbers, iteration,
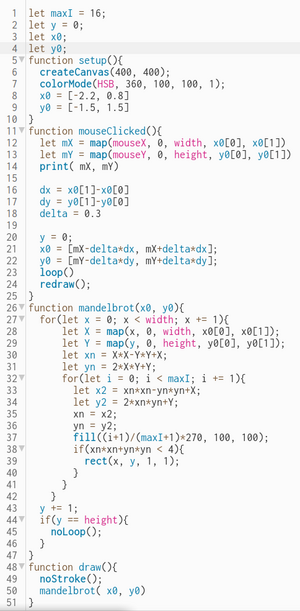
Exercises:
- Count the time needed to render the image.
Original: https://editor.p5js.org/LeopoldW/sketches/hNNXbYu5d
Digital Love Languages Sharing Sessions: Wednesday Melanie's alt account : ]
Making Blackout Poetry With Computers! Coding Tech
CP1: Collage in P5JS – Getting Portions Of An Image Jeff Thompson
Proximity Triggers for Animation and Sound with Velvet Spectrum | Adobe Creative Cloud
Creative coding with p5js: Video Pixelator Marc Duiker
RiTa and p5js Scott Fitzgerald
Creative Coding with Codecademy #1: Intro to p5.js Codecademy
How to export images and animations from p5.js Stubborn Code
Accessing Motion and Orientation on iOS13 with p5.js designers do code
Programming an Amazing Art-Making Machine in p5.js generative art Steve's Makerspace
Playing with Perlin Noise in p5.js - generative art with lots of options, plus wave convections Steve's Makerspace
2D Animations in Augmented Reality Using After Effects and Adobe Aero Heather Dunaway Smith
FAKE - p5.js Creative Code Erdmann
New Processing Course out now: "Copy and Paste" tim rodenbröker creative coding
The Adobe Fonts Show: Making your own Font with Delve Fonts Adobe Creative Cloud
How to make a flow field in p5.js | Coding Project #9 Colorful Coding
Motion with p5js Data Science for Everyone
Hartmut Bohnacker – Interactive Type using P5.js PJAIT NeMA
7.2 Mouse & Key Inputs - p5.js Tutorial xin xin
Mouse
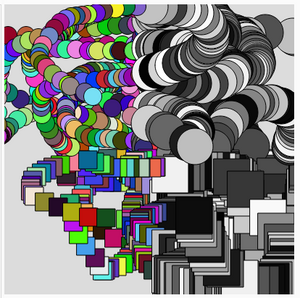
Coding: MouseX, MouseY
Math:
let brushsize = 50;
function setup() {
  createCanvas(400, 400);
}

function mouseDragged(){
  if ( mouseX < width/2 ){
    fill(random(255), random(255), random(255));
    brushsize = 25;
  } else{
    brushsize = 50;
    fill(random(255));
  }
  if ( mouseY < height/2 ){
    ellipse( mouseX, mouseY, brushsize);
  }else{
    square( mouseX, mouseY, brushsize);
  }
}

function mousePressed(){
  background(220);
}

function draw() {
}
Exercises
- Add linear change to size.
Creative Coding (01): Introduction to Processing J. Stephen Lee
How to make generative art for NFTs Computational Mama
Combining Video Frames to Create Still Images Julieanne Kost
Random Flower Grid Permutations
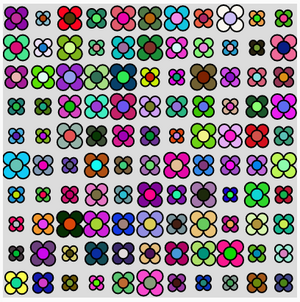
Code:
Math: Permutations,
const Nc = 11
const Nr = 10

function setup() {
  createCanvas(400, 400);
  noLoop();
  strokeWeight(2);
}

function flower(x,y,size){
  const flowerSize = random( 0.5*size, size);
  const petalSize = flowerSize/2;
  const spacing = petalSize/2;
  fill( random(255), random(255), random(255))
  circle(x-spacing,y-spacing,petalSize);
  circle(x+spacing,y-spacing,petalSize);
  circle(x-spacing,y+spacing,petalSize);
  circle(x+spacing,y+spacing,petalSize);
  fill( random(255), random(255), random(255))
  circle(x,y,petalSize);
}

function draw() {
  background(220);

  const cellWidth  = width / Nc
  const cellHeight = width / Nr

  for (let i=0; i<Nc; i++){
    for (let j=0; j<Nr; j++){
        const x = i*cellWidth + cellWidth/2;
        const y = j*cellHeight + cellHeight/2;

        flower(x,y,min(cellWidth, cellHeight))
    }
  }
}
AA - Generative Art with p5js - The Circle K Project Evan Weinberg
Illustration Masterclass: Choosing the Right Colors for Your Digital Illustrations Adobe Creative Cloud
How To Create a kaleidoscope in p5js? Computational Mama
Design an Interactive & ANIMATED Augmented Reality Scene for ADOBE AERO Kim Alban
p5.js Tutorial - Iris of an Eye Draw Make & Code
Make Beautiful 3D Flowers in p5.js: 1/2 Kazuki Umeda
Wavy Lines Art-Maker in p5.js Generative Art Steve's Makerspace
Use Illustrator Blend Tool in Your Maps: Bu
Next steps
Try to move to either pure Java or pure JavaScript (using canvas).
References
- p5js coding projects YT
- https://www.codecademy.com/resources/blog/creative-coding-p5js-examples/
- https://happycoding.io/tutorials/p5js/creating-classes
- https://showcase.p5js.org/#/2022-All/pattern-creator/
- https://happycoding.io/tutorials/p5js/array-functions#example-trail
- https://www.youtube.com/watch?v=62SbexSgQIw&list=PLPrhS0jDJbmxPXKj60YPRs04V_nqCPyZ4
- https://www.youtube.com/@ArtNowCoding/videos
- https://github.com/Tezumie/p5js-Generative-Art-Custom-Functions