OSM rivers to one main branch Python
From wikiluntti
Introduction
-

The river map of Finland. The main river is plotted using larger linewidth than the tertiarys.
-
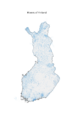
1. The first plot of all the rivers without modifications.
-
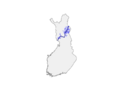
2. The main branch and tributaries.


OSM Geofabrik provides huge amount of GIS data. I need to extract one main branch of that all.
The problems are
- There are many rivers haring the same name
- The shp data breaks
- There are cycles (loops) and tributaries (branches)
1. Plot and check
The analysis of different coordinate systems is shown elsewhere.
import geopandas as gpd
import matplotlib.pyplot as plt

finland = gpd.read_file("fi.shp")
rivers = gpd.read_file("gis_osm_waterways_free_1.shp")

#Check coordinate system
print(finland.crs)
print(rivers.crs) #Says None.
rivers = rivers.set_crs(epsg=4326)
rivers = rivers.to_crs(finland.crs)

#Other coordinate system. Looks even better, more familiar
finland = finland.to_crs(epsg=3067)
rivers = rivers.to_crs(epsg=3067)

#rivers = gpd.clip(rivers, finland) # Clip rivers to Finland

# Plotting
fig, ax = plt.subplots(figsize=(6, 10))
finland.plot( ax=ax, color="#f0f0f0", edgecolor="#444444", linewidth=0.8 )
rivers.plot( ax=ax, color="#4aa3df", linewidth=0.3, alpha=0.7 )

ax.set_axis_off() # Remove axes
plt.title("Rivers of Finland", fontsize=14)
plt.show()
2. Plot Kemijoki and tributaries
The beginning (loading the river data files and converting) is the same as before.
kemijoki = rivers[rivers["name"] == "Kemijoki"]
buffer = kemijoki.buffer(50000)  # 20 km buffer around the Kemijoko
buffer_gdf = gpd.GeoDataFrame(geometry=buffer, crs=rivers.crs)

kemijoki_rivers = gpd.clip(rivers, buffer_gdf)

#Find the connected parts
main_geom = unary_union(kemijoki.geometry)
connected = kemijoki_rivers[kemijoki_rivers.geometry.intersects(main_geom)]

current = main_geom
for i in range(5):  # increase if needed
    touching = kemijoki_rivers[kemijoki_rivers.geometry.intersects(current)]
    current = unary_union(touching.geometry)

final_rivers = kemijoki_rivers[kemijoki_rivers.geometry.intersects(current)]

# Plot it
fig, ax = plt.subplots(figsize=(6, 10))
ax = finland.plot(color="#f0f0f0", edgecolor="gray")

final_rivers.plot(ax=ax, color="blue", linewidth=0.4)
kemijoki.plot(ax=ax, color="darkblue", linewidth=1.5)
ax.set_axis_off()

plt.show()
3. Plot and check
4. Plot and check


