OSM rivers to one main branch Python: Difference between revisions
From wikiluntti
| Line 8: | Line 8: | ||
OSM Geofabrik provides huge amount of GIS data. I need to extract one main branch of that all. | OSM Geofabrik provides huge amount of GIS data. I need to extract one main branch of that all. | ||
== 1. Plot and check == | |||
The analysis of different coordinate systems is shown elsewhere. | |||
<syntaxhighlight lang="Python"> | |||
import geopandas as gpd | |||
import matplotlib.pyplot as plt | |||
finland = gpd.read_file("fi.shp") | |||
rivers = gpd.read_file("gis_osm_waterways_free_1.shp") | |||
#Check coordinate system | |||
print(finland.crs) | |||
print(rivers.crs) #Says None. | |||
rivers = rivers.set_crs(epsg=4326) | |||
rivers = rivers.to_crs(finland.crs) | |||
#Other coordinate system. Looks even better, more familiar | |||
finland = finland.to_crs(epsg=3067) | |||
rivers = rivers.to_crs(epsg=3067) | |||
#rivers = gpd.clip(rivers, finland) # Clip rivers to Finland | |||
# Better plotting | |||
fig, ax = plt.subplots(figsize=(6, 10)) | |||
# Finland background | |||
finland.plot( ax=ax, color="#f0f0f0", edgecolor="#444444", linewidth=0.8 ) | |||
rivers.plot( ax=ax, color="#4aa3df", linewidth=0.3, alpha=0.7 ) | |||
ax.set_axis_off() # Remove axes | |||
plt.title("Rivers of Finland", fontsize=14) | |||
plt.show() | |||
</syntaxhighlight > | |||
== 2. Plot and check == | |||
<syntaxhighlight lang="Python"> | |||
</syntaxhighlight > | |||
== 3. Plot and check == | |||
<syntaxhighlight lang="Python"> | |||
</syntaxhighlight > | |||
== 4. Plot and check == | |||
<syntaxhighlight lang="Python"> | |||
</syntaxhighlight > | |||
== 5. Plot and check == | |||
<syntaxhighlight lang="Python"> | |||
</syntaxhighlight > | |||
== 6. Plot and check == | |||
<syntaxhighlight lang="Python"> | |||
</syntaxhighlight > | |||
Revision as of 13:48, 27 April 2026
Introduction
-

The river map of Finland. The main river is plotted using larger linewidth than the tertiarys.
-
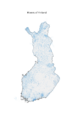
1. The first plot of all the rivers without modifications.


OSM Geofabrik provides huge amount of GIS data. I need to extract one main branch of that all.
1. Plot and check
The analysis of different coordinate systems is shown elsewhere.
import geopandas as gpd
import matplotlib.pyplot as plt

finland = gpd.read_file("fi.shp")
rivers = gpd.read_file("gis_osm_waterways_free_1.shp")

#Check coordinate system
print(finland.crs)
print(rivers.crs) #Says None.
rivers = rivers.set_crs(epsg=4326)
rivers = rivers.to_crs(finland.crs)

#Other coordinate system. Looks even better, more familiar
finland = finland.to_crs(epsg=3067)
rivers = rivers.to_crs(epsg=3067)

#rivers = gpd.clip(rivers, finland) # Clip rivers to Finland

# Better plotting
fig, ax = plt.subplots(figsize=(6, 10))

# Finland background
finland.plot( ax=ax, color="#f0f0f0", edgecolor="#444444", linewidth=0.8 )
rivers.plot( ax=ax, color="#4aa3df", linewidth=0.3, alpha=0.7 )

ax.set_axis_off() # Remove axes
plt.title("Rivers of Finland", fontsize=14)
plt.show()
2. Plot and check
3. Plot and check
4. Plot and check


