Grafana dashboard: Difference between revisions
| Line 10: | Line 10: | ||
Grafana organizeFields.png|You can rename the fields and choose the one to be displayed | Grafana organizeFields.png|You can rename the fields and choose the one to be displayed | ||
Grafana convertFieldTypes.png|Convert field types to numeric. It likes to have them as strings. | Grafana convertFieldTypes.png|Convert field types to numeric. It likes to have them as strings. | ||
Grafana xyplot.png|Finally the xy-plot works. Note the change of axis. | |||
</gallery> | </gallery> | ||
Revision as of 17:00, 1 April 2025
Introduction
-
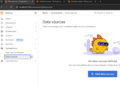
From the left menu choose Data sources.
-
-
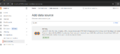
Finally the infinity after installing the plugin. Note the permissions of the folders.
-
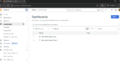
Creating a Dashboard is an easy task.
-
Add the csv
-
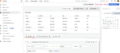
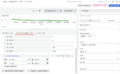
The Table works for the provided URL.
-
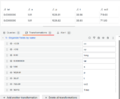
You can rename the fields and choose the one to be displayed
-
Convert field types to numeric. It likes to have them as strings.
-
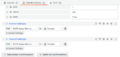
Finally the xy-plot works. Note the change of axis.


Grafana is a open source analytics application. It can produce charts, graphs, and alerts for the web when connected to supported data sources.
- https://github.com/grafana/grafana
- https://grafana.com/get/
- https://grafana.com/docs/grafana/latest/setup-grafana/installation/
Running Grafana
- Start Grafana server (grafana-server.exe). My installation is at
C:\Program Files\GrafanaLabs\grafana\bin - Use web browser to go to http://localhost:3000/login
- Default name and pwd is admin
- Create a data source.
Connections -> Data sources. EnterInfinity- However, the plugin needs to be installed first:
grafana-cli plugins install yesoreyeram-infinity-datasource. The permission of the folders have to be changed. Perhaps should allow all. Then restart grafana by:- Open the Services app.
- Right-click on the Grafana service.
- In the context menu, click Restart.
- However, the plugin needs to be installed first:
- Create a dashboard
- Add visualization. Add the
yesoreyeram-infinity-datasourcedata source- In the query section at the bottom, choose Type: CSV.
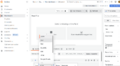
- Ensure the source is URL and the method is GET.
- For the URL, enter https://raw.githubusercontent.com/grafana/developer-advocacy/refs/heads/main/projects/Visualize%20CSV/data/worldcities.csv, which links to a CSV file full of data about world cities and their locations.
- In the upper right-hand corner of the screen, choose Table as the visualization type.
- In the query section at the bottom, choose Type: CSV.
- Map is actually Geomap.
Examples
CSV Data
- https://grafana.com/grafana/plugins/yesoreyeram-infinity-datasource/ Visualize data from JSON, CSV, XML, GraphQL and HTML endpoints.
- https://grafana.com/docs/plugins/marcusolsson-csv-datasource/latest/ in maintenance mode
GIS
Logs from Serial port
Use PuTTY and save (stream) logs to a file. Works like a charm. The notepad++ can be set to update automatically without asking (Ctrl-R reloads the file) by using Settings -> Preferences -> MISC. -> Update silently, but it still need Ctrl-R to reload the file.