OSM rivers to one main branch Python: Difference between revisions
From wikiluntti
| Line 52: | Line 52: | ||
=== The shp datafile === | === The shp datafile === | ||
< | <syntaxhighlight lang="python> | ||
print(rivers.head()) | print(rivers.head()) | ||
osm_id ... geometry | osm_id ... geometry | ||
| Line 60: | Line 60: | ||
3 4418989 ... LINESTRING (263355.182 6994559.516, 263029.852... | 3 4418989 ... LINESTRING (263355.182 6994559.516, 263029.852... | ||
4 4494437 ... LINESTRING (235473.685 6716109.64, 235468.154 ... | 4 4494437 ... LINESTRING (235473.685 6716109.64, 235468.154 ... | ||
</ | </syntaxhighlight> | ||
<syntaxhightlight lang="python> | <syntaxhightlight lang="python> | ||
print(rivers.columns) | print(rivers.columns) | ||
Index(['osm_id', 'code', 'fclass', 'width', 'name', 'geometry'], dtype='object') | Index(['osm_id', 'code', 'fclass', 'width', 'name', 'geometry'], dtype='object') | ||
</ | </syntaxhighlight> | ||
< | <syntaxhighlight lang="python> | ||
print(rivers.geometry) | print(rivers.geometry) | ||
0 LINESTRING (384623.065 6671261.378, 384613.062... | 0 LINESTRING (384623.065 6671261.378, 384613.062... | ||
| Line 79: | Line 79: | ||
127502 LINESTRING (543881.124 6893248.187, 543974.428... | 127502 LINESTRING (543881.124 6893248.187, 543974.428... | ||
Name: geometry, Length: 127503, dtype: geometry | Name: geometry, Length: 127503, dtype: geometry | ||
</ | </syntaxhighlight> | ||
== 2. Plot Kemijoki and tributaries == | == 2. Plot Kemijoki and tributaries == | ||
Revision as of 19:56, 27 April 2026
Introduction
-

The river map of Finland. The main river is plotted using larger linewidth than the tertiarys.
-
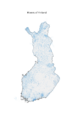
1. The first plot of all the rivers without modifications.
-
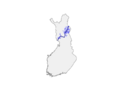
2. The main branch and tributaries.


OSM Geofabrik provides huge amount of GIS data. I need to extract one main branch of that all.
The problems are
- There are many rivers haring the same name
- The shp data breaks
- There are cycles (loops) and tributaries (branches)
1. Plot and check
The analysis of different coordinate systems is shown elsewhere.
1
import geopandas as gpd
import matplotlib.pyplot as plt

finland = gpd.read_file("fi.shp")
rivers = gpd.read_file("gis_osm_waterways_free_1.shp")

#Check coordinate system
print(finland.crs)
print(rivers.crs) #Says None.
rivers = rivers.set_crs(epsg=4326)
rivers = rivers.to_crs(finland.crs)

#Other coordinate system. Looks even better, more familiar
finland = finland.to_crs(epsg=3067)
rivers = rivers.to_crs(epsg=3067)

#rivers = gpd.clip(rivers, finland) # Clip rivers to Finland

# Plotting
fig, ax = plt.subplots(figsize=(6, 10))
finland.plot( ax=ax, color="#f0f0f0", edgecolor="#444444", linewidth=0.8 )
rivers.plot( ax=ax, color="#4aa3df", linewidth=0.3, alpha=0.7 )

ax.set_axis_off() # Remove axes
plt.title("Rivers of Finland", fontsize=14)
plt.show()
The shp datafile
print(rivers.head())
    osm_id  ...                                           geometry
0  4251428  ...  LINESTRING (384623.065 6671261.378, 384613.062...
1  4336744  ...  LINESTRING (424219.382 6758572.023, 424231.281...
2  4418854  ...  LINESTRING (271969.063 6961997.189, 272511.243...
3  4418989  ...  LINESTRING (263355.182 6994559.516, 263029.852...
4  4494437  ...  LINESTRING (235473.685 6716109.64, 235468.154 ...
<syntaxhightlight lang="python> print(rivers.columns) Index(['osm_id', 'code', 'fclass', 'width', 'name', 'geometry'], dtype='object') </syntaxhighlight>
print(rivers.geometry)
0         LINESTRING (384623.065 6671261.378, 384613.062...
1         LINESTRING (424219.382 6758572.023, 424231.281...
2         LINESTRING (271969.063 6961997.189, 272511.243...
3         LINESTRING (263355.182 6994559.516, 263029.852...
4         LINESTRING (235473.685 6716109.64, 235468.154 ...
                                ...
127498    LINESTRING (193860.594 6771306.041, 193862.48 ...
127499    LINESTRING (193500.06 6770531.712, 193481.661 ...
127500    LINESTRING (267357.405 6823421.996, 267348.152...
127501    LINESTRING (266604.152 6824271.814, 266614.528...
127502    LINESTRING (543881.124 6893248.187, 543974.428...
Name: geometry, Length: 127503, dtype: geometry
2. Plot Kemijoki and tributaries
The beginning (loading the river data files and converting) is the same as before.
kemijoki = rivers[rivers["name"] == "Kemijoki"]
buffer = kemijoki.buffer(50000)  # 20 km buffer around the Kemijoko
buffer_gdf = gpd.GeoDataFrame(geometry=buffer, crs=rivers.crs)

kemijoki_rivers = gpd.clip(rivers, buffer_gdf)

#Find the connected parts
main_geom = unary_union(kemijoki.geometry)
connected = kemijoki_rivers[kemijoki_rivers.geometry.intersects(main_geom)]

current = main_geom
for i in range(5):  # increase if needed
    touching = kemijoki_rivers[kemijoki_rivers.geometry.intersects(current)]
    current = unary_union(touching.geometry)

final_rivers = kemijoki_rivers[kemijoki_rivers.geometry.intersects(current)]

# Plot it
fig, ax = plt.subplots(figsize=(6, 10))
ax = finland.plot(color="#f0f0f0", edgecolor="gray")

final_rivers.plot(ax=ax, color="blue", linewidth=0.4)
kemijoki.plot(ax=ax, color="darkblue", linewidth=1.5)
ax.set_axis_off()

plt.show()
3. Plot and check
4. Plot and check


