Grafana dashboard: Difference between revisions
| (48 intermediate revisions by the same user not shown) | |||
| Line 1: | Line 1: | ||
== Introduction == | == Introduction == | ||
<gallery> | |||
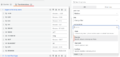
Grafana_datasources.png|From the left menu choose Data sources. | |||
Grafana_AddDataSource.png| | |||
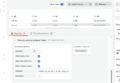
Grafana_addInfinity.png|Finally the infinity after installing the plugin. Note the permissions of the folders. | |||
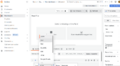
Grafana_createDashboard.png|Creating a Dashboard is an easy task. | |||
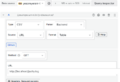
Grafana_csv.png|Add the csv | |||
Garafana localhost putty.png|Add the csv file from localhost using nginx. | |||
Grafana_toTableFromwww.png|The Table works for the provided URL. | |||
Grafana organizeFields.png|You can rename the fields and choose the one to be displayed | |||
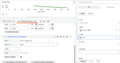
Grafana convertFieldTypes.png|Convert field types to numeric. It likes to have them as strings. | |||
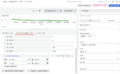
Grafana divideTimeBy1000.png|Divide the time by 1000 to convert from ms to seconds. | |||
Grafana xyplot.png|Finally the xy-plot works. Note the change of axis. | |||
Grafana autoupdate refresh.png|Set autoupdate. Note that zooming is lost. | |||
</gallery> | |||
<gallery> | |||
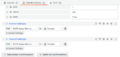
Grafana setHeaders.png|Set headers! | |||
</gallery> | |||
Grafana is a open source analytics application. It can produce charts, graphs, and alerts for the web when connected to supported data sources. | Grafana is a open source analytics application. It can produce charts, graphs, and alerts for the web when connected to supported data sources. | ||
| Line 7: | Line 27: | ||
* https://grafana.com/docs/grafana/latest/setup-grafana/installation/ | * https://grafana.com/docs/grafana/latest/setup-grafana/installation/ | ||
Running Grafana | |||
#Start Grafana server (grafana-server.exe). My installation is at <code>C:\Program Files\GrafanaLabs\grafana\bin</code> | |||
#Use web browser to go to http://localhost:3000/login | |||
#* Default name and pwd is admin | |||
# Create a data source. <code>Connections -> Data sources</code>. Enter <code>Infinity</code> | |||
#* However, the plugin needs to be installed first: <code>grafana-cli plugins install yesoreyeram-infinity-datasource</code>. The permission of the folders have to be changed. Perhaps should allow all. Then restart grafana by: | |||
#*# Open the Services app. | |||
#*# Right-click on the Grafana service. | |||
#*# In the context menu, click Restart. | |||
# Create a dashboard | |||
# Add visualization. Add the <code>yesoreyeram-infinity-datasource</code> data source | |||
#* In the query section at the bottom, choose Type: CSV. | |||
#*# Ensure the source is URL and the method is GET. | |||
#*# For the URL, enter https://raw.githubusercontent.com/grafana/developer-advocacy/refs/heads/main/projects/Visualize%20CSV/data/worldcities.csv, which links to a CSV file full of data about world cities and their locations. | |||
#*# In the upper right-hand corner of the screen, choose Table as the visualization type. | |||
# Map is actually Geomap. | |||
== Examples == | == Examples == | ||
=== CSV Data === | === CSV Data === | ||
* https://grafana.com/grafana/plugins/yesoreyeram-infinity-datasource/ Visualize data from JSON, CSV, XML, GraphQL and HTML endpoints. | |||
** https://grafana.com/blog/2025/02/05/how-to-visualize-csv-data-with-grafana/ | |||
** Documentation https://grafana.com/docs/plugins/yesoreyeram-infinity-datasource/latest/ | |||
** CSV Docs https://grafana.com/docs/plugins/yesoreyeram-infinity-datasource/latest/csv/ | |||
* https://grafana.com/docs/plugins/marcusolsson-csv-datasource/latest/ in maintenance mode | |||
=== GIS === | === GIS === | ||
<gallery> | |||
Grafana latlong.png|Change Auto to Lat Long if not working. | |||
</gallery> | |||
Geomap | |||
=== JSON data === | |||
Need to have stream of JSON | |||
The following array works, but there is the problem with brackets. | |||
<syntaxhighlight lang="json"> | |||
[{ | |||
"name": "John", | |||
"age": 30, | |||
"city": "New York" | |||
}, | |||
{ | |||
"name": "Jussi", | |||
"age": 32, | |||
"city": "New York C" | |||
}] | |||
</syntaxhighlight> | |||
=== Window functions === | |||
https://community.grafana.com/t/grafana-v11-0-0-why-windows-function-mode-is-missing-in-data-transformation-menu/129571 | |||
=== Regression analysis === | |||
== Logs from Serial port == | == Logs from Serial port == | ||
Use [[Arduino_radio_hc-12#Terminal_program|PuTTY]] and save (stream) logs to a file. | '''RealTerm''': Serial/TCP Terminal (https://sourceforge.net/projects/realterm/) by Crun is a rather easy and good behaving serial port logger with timestamps. It also shows the name of peripheral attached to the COM (USB) port. It can show also the I2C data. | ||
'''Putty:''' cannot add the timestamp. There are some extraplugins, but I will skip those. Use [[Arduino_radio_hc-12#Terminal_program|PuTTY]] and save (stream) logs to a file. Works like a charm. The notepad++ can be set to update automatically without asking (Ctrl-R reloads the file) by using <code>Settings -> Preferences -> MISC. -> Update silently</code>, but it still need Ctrl-R to reload the file. | |||
However, Grafana cannot update a local file. Instead use a web server (eg nginx) to serve the CSV files over http and then use http url (eg http://localhost/my-csv-app/my-csv-file.csv). | |||
=== NGinx === | |||
See https://medium.com/@jasonrigden/how-to-host-a-static-website-with-nginx-8b2dd0c5b301 | |||
* Download, run | |||
** <code>start nginx</code> and check with <code>tasklist.exe</code>. It should show two nginx instances. One of the processes is the master process and another is the worker process. | |||
* Goto address http://localhost/ and the file location is at <code>nginx -> html</code>. | |||
* Check config. | |||
** <code>nginx.conf</code> is important. See <code>location</code> which states that root is html. | |||
== See also == | |||
However, decided to work with python, because this requires multiple programs to be running and the mathematical possibilities are too limited in Grafana. | |||
Latest revision as of 19:26, 11 April 2025
Introduction
-
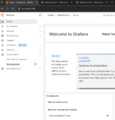
From the left menu choose Data sources.
-
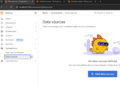
-
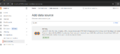
Finally the infinity after installing the plugin. Note the permissions of the folders.
-
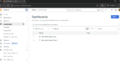
Creating a Dashboard is an easy task.
-
Add the csv
-
Add the csv file from localhost using nginx.
-
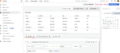
The Table works for the provided URL.
-
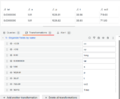
You can rename the fields and choose the one to be displayed
-
Convert field types to numeric. It likes to have them as strings.
-
Divide the time by 1000 to convert from ms to seconds.
-
Finally the xy-plot works. Note the change of axis.
-
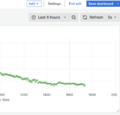
Set autoupdate. Note that zooming is lost.


-
Set headers!

Grafana is a open source analytics application. It can produce charts, graphs, and alerts for the web when connected to supported data sources.
- https://github.com/grafana/grafana
- https://grafana.com/get/
- https://grafana.com/docs/grafana/latest/setup-grafana/installation/
Running Grafana
- Start Grafana server (grafana-server.exe). My installation is at
C:\Program Files\GrafanaLabs\grafana\bin - Use web browser to go to http://localhost:3000/login
- Default name and pwd is admin
- Create a data source.
Connections -> Data sources. EnterInfinity- However, the plugin needs to be installed first:
grafana-cli plugins install yesoreyeram-infinity-datasource. The permission of the folders have to be changed. Perhaps should allow all. Then restart grafana by:- Open the Services app.
- Right-click on the Grafana service.
- In the context menu, click Restart.
- However, the plugin needs to be installed first:
- Create a dashboard
- Add visualization. Add the
yesoreyeram-infinity-datasourcedata source- In the query section at the bottom, choose Type: CSV.
- Ensure the source is URL and the method is GET.
- For the URL, enter https://raw.githubusercontent.com/grafana/developer-advocacy/refs/heads/main/projects/Visualize%20CSV/data/worldcities.csv, which links to a CSV file full of data about world cities and their locations.
- In the upper right-hand corner of the screen, choose Table as the visualization type.
- In the query section at the bottom, choose Type: CSV.
- Map is actually Geomap.
Examples
CSV Data
- https://grafana.com/grafana/plugins/yesoreyeram-infinity-datasource/ Visualize data from JSON, CSV, XML, GraphQL and HTML endpoints.
- https://grafana.com/docs/plugins/marcusolsson-csv-datasource/latest/ in maintenance mode
GIS
-
Change Auto to Lat Long if not working.

Geomap
JSON data
Need to have stream of JSON
The following array works, but there is the problem with brackets.
[{
  "name": "John",
  "age": 30,
  "city": "New York"
},
{
  "name": "Jussi",
  "age": 32,
  "city": "New York C"
}]
Window functions
Regression analysis
Logs from Serial port
RealTerm: Serial/TCP Terminal (https://sourceforge.net/projects/realterm/) by Crun is a rather easy and good behaving serial port logger with timestamps. It also shows the name of peripheral attached to the COM (USB) port. It can show also the I2C data.
Putty: cannot add the timestamp. There are some extraplugins, but I will skip those. Use PuTTY and save (stream) logs to a file. Works like a charm. The notepad++ can be set to update automatically without asking (Ctrl-R reloads the file) by using Settings -> Preferences -> MISC. -> Update silently, but it still need Ctrl-R to reload the file.
However, Grafana cannot update a local file. Instead use a web server (eg nginx) to serve the CSV files over http and then use http url (eg http://localhost/my-csv-app/my-csv-file.csv).
NGinx
See https://medium.com/@jasonrigden/how-to-host-a-static-website-with-nginx-8b2dd0c5b301
- Download, run
start nginxand check withtasklist.exe. It should show two nginx instances. One of the processes is the master process and another is the worker process.
- Goto address http://localhost/ and the file location is at
nginx -> html. - Check config.
nginx.confis important. Seelocationwhich states that root is html.
See also
However, decided to work with python, because this requires multiple programs to be running and the mathematical possibilities are too limited in Grafana.