Antenna Design and NanoVNA: Difference between revisions
| (3 intermediate revisions by the same user not shown) | |||
| Line 90: | Line 90: | ||
<gallery> | <gallery> | ||
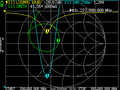
Antenna monopole 18-8.png|18.8 cm; Resonances at 220MHz and 484 MHz. | Antenna monopole 18-8.png|18.8 cm; Resonances at 220MHz and 484 MHz. | ||
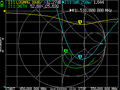
Antenna monopole 18-8-2.png|18.8 cm; Closer look at 220 MHz resonance. | |||
Antenna_monopole_18-8-3.png|18.8 cm; Closer look at 484 MHz resonance. | |||
Antenna monopole 20-8.png|20.8 cm; Small resonances at 244MHz and 484 MHz. | Antenna monopole 20-8.png|20.8 cm; Small resonances at 244MHz and 484 MHz. | ||
Antenna monopole 20-8-2.png|20.8 cm; Closer look at the other resonance. | |||
Antenna monopole 16-8-3.png|16.8 cm; Other resonance. | |||
</gallery> | </gallery> | ||
| Line 97: | Line 102: | ||
{| class="wikitable" | {| class="wikitable" | ||
|+ | |+ The resonances of quarter wave monopole antennas measured with NanoVNA and using its black short cable. Calibrated first to 100-900 MHz and to the two resonances. | ||
|- | |- | ||
! Length !! Resonance 1 !! Resonance 2 | ! Length !! Resonance 1 !! Resonance 2 | ||
|- | |- | ||
| 16.8 cm || 236 MHz || 524 MHz | | 16.8 cm || 236 MHz -> 229 MHz || 524 MHz -> 516 MHz | ||
|- | |- | ||
| 17.3 cm || 237 MHz || 516 MHz | | 17.3 cm || 237 MHz -> 232 MHz || 516 MHz -> 508 MHz | ||
|- | |- | ||
| 18.8 cm || 220 MHz || 484 MHz | | 18.8 cm || 220 MHz -> 216 MHz || 484 MHz -> 496 MHz | ||
|- | |- | ||
| 20.8 cm || 244 MHz || 484 MHz | | 20.8 cm || 244 MHz -> 237 MHz || 484 MHz -> 487 MHz | ||
|} | |} | ||
Latest revision as of 17:27, 7 February 2025
Introduction
NanoVNA is a simple but powerful tool to analyze antennas.
VNA: Vector Network Analyzer
SWR: Standing Wave Ratio measures the degree of mismatch between a transmission line and its load. SWR is a measure of what is happening to the forward and reflected voltage waveforms and how they compare in size.
See more info at https://nanovna.com/
Theory
Main Screen
- Start/Stop frequency at the bottom
- Marker
- Calibration status on the right side.
- C0-C4: Corresponding calibration data is loaded
- c0-c4: Corresponding calibration data is loaded, but the frequency range has been changed.
- D direcitivity error
- R Error correction is applied: Reflection
- S Error correction is applied: Source
- T Error correction is applied: Transmission
- X Error correction is applied: Isolation/ Crosstalk
- Reference position. Yellow Horizontal line. (DISPLAY -> SCALE -> REFERENCE POSITION)
- Trace status. Trace formats are following
- LOGMAG: Logarithm of absolute value of measured value
- PHASE: Phase in the range of -180 ° to + 180 °
- DELAY: Delay
- SMITH: Smith Chart
- SWR: Standing Wave Ratio
- POLAR: Polar coordinate format
- LINEAR: Absolute value of the measured value
- REAL: Real number of measured value
- IMAG: Imaginary number of measured value
- RESISTANCE: Resistance component of the measured impedance
- REACTANCE: The reactance component of the measured impedance
- Battery status
Calibration
NanoVNA should be calibrated always when the frequency range is changed.
- CAL RESET
- Connect OPEN standard to port 1 (CH0) and execute CAL CALIBRATE OPEN.
- Connect SHORT standard to port 1 (CH0) and execute CAL CALIBRATE SHORT.
- Connect the LOAD standard to the port 1 (CH0) and execute CAL CALIBRATE LOAD.
- Connect the LOAD standard to port 1(CH0) and port 2 (CH1) and execute CAL CALIBRATE ISOLN. If there is only one load, connect the LOAD standard to port 1 (CH0), the port 2 (CH1) can be left unconnected.
- Connect cables to the port 1 (CH0) and port 2 (CH1), connect the cables with the through connectors, and execute CAL CALIBRATE THRU.
- End calibration and calculate error correction information CAL CALIBRATE DONE
- Specify the data number and save. CAL CALIBRATE SAVE SAVE 0
Antenna Measurements
Use Port 1 when measuring one port devices.
NanoVNA draws the measurement result on the screen as a graph of the measured quantity versus frequency or on the Smith Chart.
M1: Marker position
For antenna measurements:
- Traces
- CH0/ S11 (Yellow), refl: LogMax
- CH0/ S11 (Green), refl: Smith
- CH0/ S11 (Yellow), refl: SWR
- CH1 (Purple): Nothing
- Frequency Range
- STIMULUS: Start/ Stop.
- Calibrate
- CALIBRATE -> RESET
- CALIBRATE: OPEN, SHORT, LOAD and DONE. SAVE to location.
- MARKER -> SEARCH -> MINIMUM
Before each measurement:
- which traces we want to display (up to four or three plus Smith Chart)
- DISPLAY -> CHANNEL -> CH0 Reflect for antennas.
- trace channel (CH0 REFLECT or CH1 THROUGH) for each trace separately
- DISPLAY -> TRACE. Click multiple times.
- Active Trace.
- trace format (unit of measurement of each format)
- scale (how many units of measurement per each horizontal line, for each trace separately)
- reference position for each trace separately
- sweep frequency (stimulus frequency range)
- calibrate the NanoVNA
Antennas: 433 MHz
Monopole
-
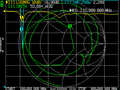
18.8 cm; Resonances at 220MHz and 484 MHz.
-
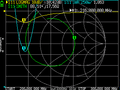
18.8 cm; Closer look at 220 MHz resonance.
-
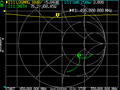
18.8 cm; Closer look at 484 MHz resonance.
-
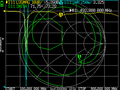
20.8 cm; Small resonances at 244MHz and 484 MHz.
-
20.8 cm; Closer look at the other resonance.
-
16.8 cm; Other resonance.


Quarter wave wire antenna;

| Length | Resonance 1 | Resonance 2 |
|---|---|---|
| 16.8 cm | 236 MHz -> 229 MHz | 524 MHz -> 516 MHz |
| 17.3 cm | 237 MHz -> 232 MHz | 516 MHz -> 508 MHz |
| 18.8 cm | 220 MHz -> 216 MHz | 484 MHz -> 496 MHz |
| 20.8 cm | 244 MHz -> 237 MHz | 484 MHz -> 487 MHz |
Dipole
https://www.electrical4u.com/dipole-antenna/ - Folded Dipole Antenna - Two-Wire Folded Dipole Antenna - Three Wire Folded Dipole Antenna (Folded Tripole)